
NQ Has to Earn the Bounce
The prior-year high gave us a trade. It did not erase the downtrend. Here is the level map and the calendar for November 9–13.
Week Ahead | November 9–13, 2026
A good trade off a low does not mean the whole market has turned. That is the first rule for this week.
Thursday's IF trade came at the prior-year high. Friday brought a bounce in Nasdaq futures. But NQ still could not reach Thursday's median. We can respect the trade and stay careful about what comes next.
This week puts inflation back on the clock: CPI on Tuesday and PPI on Friday. Wednesday is Veterans Day, with stocks open and a full-close recommendation for the U.S. bond market. The plan is not to guess which headline wins. Mark the levels. Know the news times. Wait for price to show its hand.
What last week left on the map
Our November 3 prep named 26,399 as NQ's prior-year high before Thursday's trade. Michael's working buy order and entry mark were 26,399.50. Later chart labels read 26,399.00 for PYH, or prior-year high.
That small label difference does not get rounded out of the trade receipt. The order was at 26,399.50. Our prep marked the yearly high at 26,399.
Those prices give us a place to watch, not a standing order to buy every return. If price comes back, ask whether buyers can hold it. If price breaks below and cannot get back over it, the old high is not doing the same job.
Here are the NQ levels on our map:
| NQ reference | Price | What it means for the plan |
|---|---|---|
| Prior-year high | 26,399.00 | The old yearly level behind Thursday's IF trade |
| July low | 27,201.50 | An older price to watch on a retest |
| Thursday's median | 27,473.125 | A rebound test Friday did not reach |
| Daily-stamp midpoint | 27,652 | Earlier support that broke Thursday |
| October low | 28,232.75 | A larger line buyers would need to win back |
| October 28 swing high | 30,178 | The distant daily-close test in our recent larger trend plan |
These are older structure levels, not a new weekly expected-move band. The Thursday median remains Thursday's median; it is not Monday's prior-day median. The October 28 high is not last week's high for November 9–13.
The Thursday prep and Friday closing review supply the overhead tests. Do not treat the whole list as price targets that must trade. Take the next test first.
Expected move, in plain words
The expected move is the range the options market prices for a set time. A daily band covers a day. A weekly band covers a week. The settle is the exchange's official closing price used in the calculation.
The band helps us judge how far price has already gone. It does not stop price. NQ crossed Friday's expected-move high, then finished back inside the band. A break alone did not clear the next level.
This map uses old price levels, not a fresh weekly expected-move band. Do not carry Friday's daily band or last week's weekly band into the new week. Check the daily prep for fresh bands before you trade.
Key Levels are prices known before the trade: old highs, lows, opens, closes, and medians. A range median is halfway between its high and low. Our key-level tools let us read those prices from the daily chart up through the yearly chart.
The big chart gives us the place. The smaller chart helps us judge the trade there. Neither removes risk.
The calendar: inflation comes first
Times below are HST / ET. Eastern Time is five hours ahead of Hawaii this week. These are scheduled events, not forecasts.
| Day | Event | Time or session |
|---|---|---|
| Monday, November 9 | U.S. wholesale inventories | 5:00 a.m. HST / 10:00 a.m. ET |
| Monday, November 9 | Take-Two and Rocket Lab earnings | After the U.S. cash close |
| Tuesday, November 10 | October CPI and real earnings | 3:30 a.m. HST / 8:30 a.m. ET |
| Tuesday, November 10 | CoreWeave earnings | After the U.S. cash close |
| Wednesday, November 11 | Veterans Day | See market-hours note below |
| Thursday, November 12 | Initial jobless claims | 3:30 a.m. HST / 8:30 a.m. ET |
| Thursday, November 12 | Nebius earnings | Before the U.S. cash open |
| Thursday, November 12 | Cisco and Applied Materials earnings | After the U.S. cash close |
| Friday, November 13 | October PPI | 3:30 a.m. HST / 8:30 a.m. ET |
CPI tracks consumer prices. PPI tracks producer prices. Both can change rate bets fast. The BLS calendar confirms those release dates and times. The other data and earnings slots are from Schwab Network's weekly calendar. Schedules can change.
For Wednesday, U.S. stocks keep normal hours: 4:30–11:00 a.m. HST / 9:30 a.m.–4:00 p.m. ET. NYSE's holiday schedule does not list a Veterans Day closure. SIFMA recommends a full close for the U.S. bond markets it covers.
CME equity index futures are scheduled for normal hours, not a full holiday shutdown; the dated equity-futures calendar confirms that. Do not apply that to every futures product. Check CME's schedule and your broker for the contract you trade. Stocks open does not mean every market is open.
What to do with the map
If NQ keeps climbing: Watch how it acts at the old levels overhead. Getting above a line is one step. Holding it on a pullback is another. The broken stamp midpoint at 27,652 does not become support just because price gets near it again.
If the bounce fails: Watch the return toward the prior-year high. A second test is not the first test all over again. Do not copy last week's entry just because the number is still on the chart. Decide what a failed hold looks like before taking risk.
If price runs on CPI or PPI: Let the first burst go if you cannot set clear risk. A fast move through a level is not the same as a clean test. Missing a trade costs less than making up a reason to chase one.
Keep last week's lesson, not last week's size
The IF order was shown in Discord before it hit. Michael's recap says it triggered a few minutes after the reopen; his weekend account places it inside the first 30 minutes of the after-hours session. The follow-up showed adds to the winner.
That is a process lesson, not a size guide. We are not asking readers to use his contract count. Plan the risk for your own account. Adding to a winner still adds risk.
Our specialty is the patience and discipline to wait for high-quality trades. That does not change because a new week starts or an inflation report is due.
If you want to see more of the work behind that plan, you can register and explore what we offer. Our plans include key levels, alerts, and market insights. Use them to build a plan before price gets there, not a reason to trade every move.
This is a planning guide, not a promise of a price path or a trade recommendation. Futures trading can lead to large losses.
Related Articles
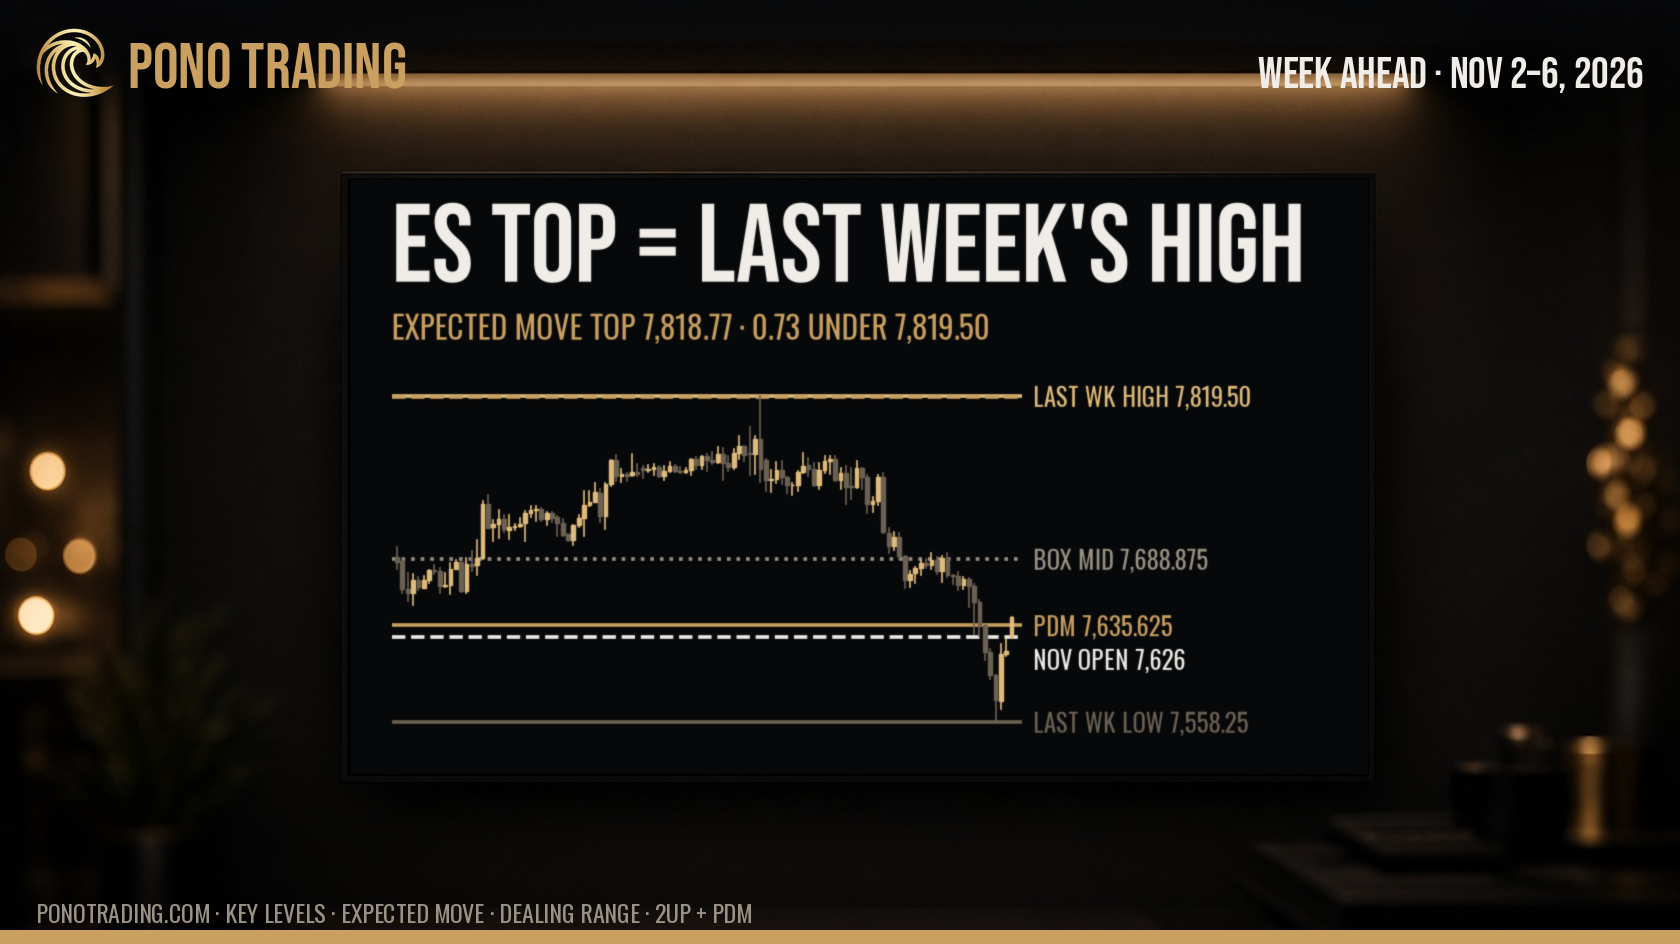
This Week's ES Ceiling Is Last Week's High
ES's weekly expected move tops out 0.73 points under last week's high. Our Key Levels, the weekly range and the 2Up + PDM setup for Apple, the vote and jobs.

Last Week's Floors Are This Week's Ceilings
Friday's board: 34 UW taps, 23 MedianReclaim tags, and last week's Nasdaq floors now overhead. Fed blackout, Netflix, Tesla and Meta. Weekly expected moves.

Bonds Take Monday Off, CPI Clocks In Wednesday
Last week's board: 145 UW taps, 151 MedianReclaim tags. Bonds close Monday, banks report Tuesday, CPI hits Wednesday. Weekly expected moves and levels.