
The Never-Red Trade Was Planned Before the Bell
A premarket UW rejection formed a double top. PonoTrading's analyst staged a five-contract NQ short inside the structure, paid himself at the London and Asia midpoints, and held three contracts for the NYC level and RTH gap fill.
Friday, August 21, 2026
The best trade on Friday did not begin with a prediction. It began with a rejection, a map, and the patience to let price come to the order.
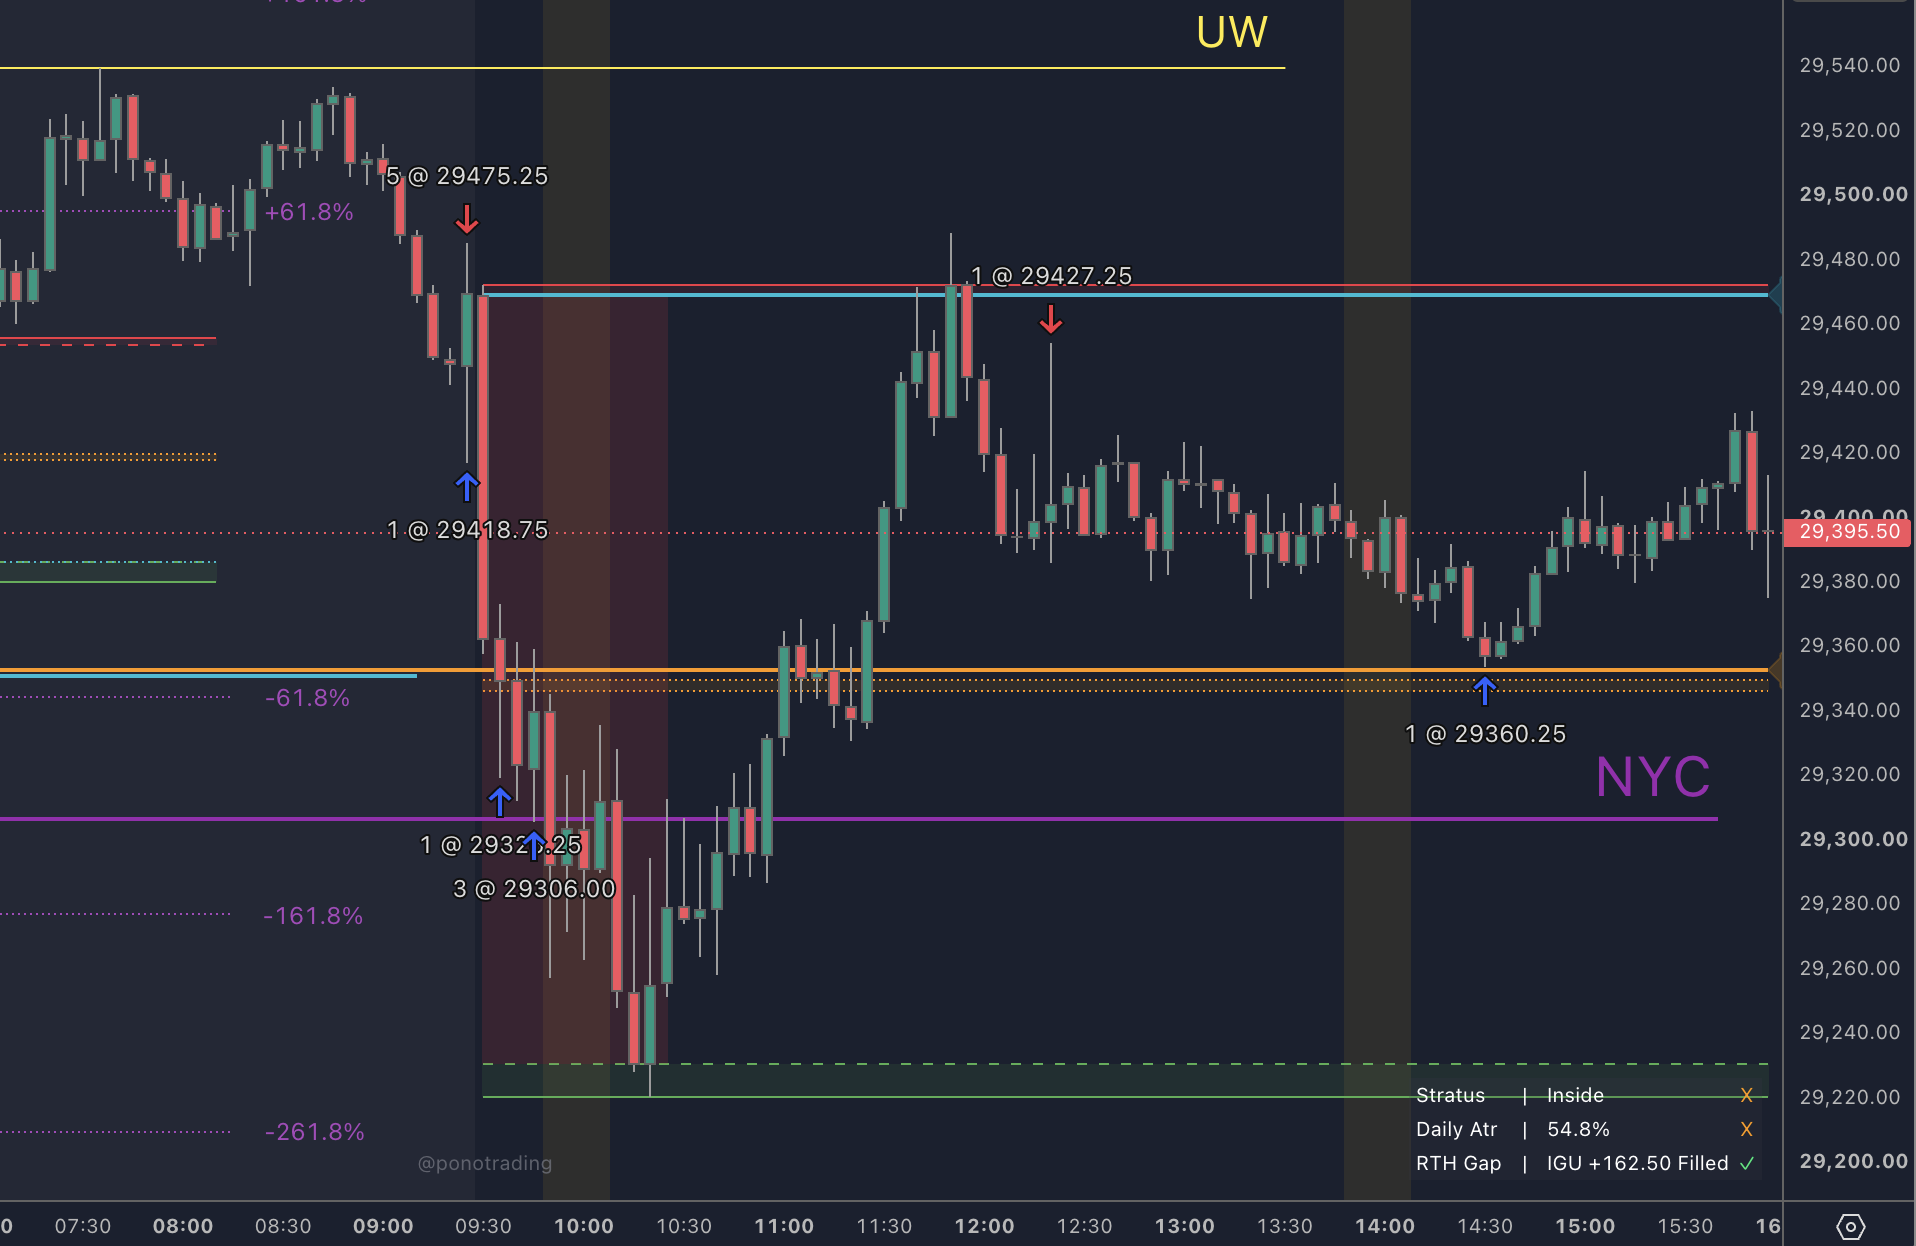
Before the New York cash open, NQ tapped a PonoTrading UW level, rejected it, and returned to form a double top. PonoTrading's in-house analyst shared the setup logic in the Discord community before the bell, then placed a five-contract short entry at 29,475.25, just inside that structure.
The entry triggered. The trade never needed a rescue narrative.
One contract came off at the midpoint of the London session range. A second came off at the midpoint of the Asia session range. The final three contracts were reserved for the NYC level at 29,306.00, where price also completed the regular-trading-hours gap fill.
That is not hindsight chart art. That is what it looks like when data, price structure, predefined destinations, and disciplined execution are on the screen before the move.
Five Contracts, Three Decisions
The short was not managed as one all-or-nothing bet. Each exit had a job.
- Entry: 29,475.25, 5 short. Inside the premarket double-top after the UW tap and rejection.
- First target: 29,427.25, 1 off. Midpoint of the London session range.
- Second target: 29,418.75, 1 off. Midpoint of the Asia session range.
- Final target: 29,306.00, 3 off. NYC level and the completed RTH gap fill.
From entry to the final destination, the chart mapped 169.25 NQ points of directional movement. That figure describes the distance between levels, not a claim about net account profit. The important part is the sequence: reduce exposure at meaningful locations, preserve a core position for the larger objective, and never turn a planned trade into a hope trade.
Why the Setup Existed Before the Entry
A double top by itself is not a trade plan. It becomes useful when it forms at a location that already matters.
The UW tap supplied that location. The rejection showed that price could not immediately accept above it. The return into the same area created the double-top structure. Placing the short just inside that structure meant the analyst did not have to chase the first red candle or invent an entry after momentum had already expanded.
The targets were equally deliberate:
- The London midpoint was an established intraday liquidity reference.
- The Asia midpoint provided the next session-based destination.
- The NYC level aligned with the unfilled RTH gap, giving the remaining position a confluence target rather than an arbitrary round-number exit.
The edge was not any single line. It was the agreement between location, rejection, structure, and destinations.
What the Morning Market Pulse Got Right
Friday's Market Pulse carried one central warning: the overnight equity bounce did not have bond-market confirmation, and the cash session still had to accept it.
Thursday had sold off across every major cash index. Overnight NQ rebounded, but the 10-year yield remained near 4.71% and the 30-year near 5.25%. The brief told traders not to confuse green Globex futures with repaired cash-session structure. It also identified 9:45 a.m. ET flash PMI, fifteen minutes after the open, as the event that could confirm or kill the initial move.
Friday delivered exactly the kind of two-stage session that warning anticipated. The premarket bounce ran into a mapped UW, failed to gain acceptance, and produced the short structure. Then the economic data complicated the macro tape: services accelerated while manufacturing softened.
S&P Global's flash services PMI rose to 56.8 from 54.6, the strongest reading since December 2024. The composite index climbed to 56.0 from 54.5, its highest since April 2022. Manufacturing eased to 53.2 from 53.9, a five-month low.
The market did not collapse on that mixed message. It rotated and recovered broadly while Treasury yields remained jumpy. That is why the morning short and the closing scoreboard can both be true. The analyst traded a specific rejection into known liquidity before the broader cash market finished repairing.
The Closing Scorecard
The major cash indexes finished higher Friday, trimming but not erasing the week's damage.
- S&P 500: 7,674.37, +0.4% Friday, -1.4% on the week
- Dow Jones Industrial Average: 53,277.01, +1.0% Friday, -0.8% on the week
- Nasdaq Composite: 26,180.45, +0.4% Friday, -2.1% on the week
- Russell 2000: 3,017.87, +0.9% Friday, -1.6% on the week
The Dow and Russell outperformed the Nasdaq on the day. That breadth matters. It says the recovery was broader than a simple technology rebound, even as the Nasdaq still posted the weakest weekly result of the four major indexes.
The morning map did not promise a red close. It said the overnight bounce needed acceptance, bonds had not confirmed it, and traders should let the open and PMI reveal which story survived. The UW rejection supplied an executable short before the later broad-market recovery changed the character of the session.
That is how professional intraday context works: the close does not invalidate a trade taken from a valid earlier structure, and a good morning short does not require a bearish opinion for the rest of the day.
The PonoTrading Take
A level is not an entry. A pattern is not a target. The trade appears when location, confirmation, risk, and destination line up at the same time.
Friday's five-contract short demonstrates the complete workflow:
- The PonoTrading tools identified the UW location.
- Price tapped and rejected it before the cash open.
- The second test formed a defined double-top structure.
- The entry sat inside that structure instead of chasing expansion.
- Session midpoints paid the trader while price moved toward the larger objective.
- The remaining position reached the NYC level as the RTH gap filled.
The result was not created by holding five contracts and hoping for the low. It came from taking profits at key locations while preserving enough size to capitalize when the complete path unfolded.
Lock the Same Map Tonight
The trade idea was in the PonoTrading Discord before the cash open. That is the point. The UW, the session mids, the NYC level, and the room were already on the map. That stack is Kahuna.
Until midnight tonight, Hawaii time, Kahuna is still $59 a month ($159.30 every 3 months, or $283.20 every 6 months). Haumana is still $29 a month ($78.30 every 3 months, or $139.20 every 6 months). After tonight those founding rates go away. If you want one of those rates, lock it in now. Already on Haumana or Kahuna at these prices? You keep that rate for as long as the membership stays active.
Join Kahuna at the current rate
Bottom Line
Friday's closing indexes were green. The week's indexes were still red. In between those two facts, NQ delivered a clean intraday sequence from a premarket UW rejection and double top into the London midpoint, Asia midpoint, NYC level, and completed RTH gap fill.
The analyst did not need to predict the entire session. He needed the right location, a confirmed pattern, controlled risk, and targets that price already had a reason to seek.
That is the difference between watching a move and having a plan for it.
"Never-red trade" describes this documented execution sequence; it is not a promise that this setup or any future trade cannot lose. The chart is one historical example and is not representative of all results. Futures involve substantial risk. Level-to-level distance is not net profit, and commissions, slippage, fills, and risk controls affect actual results. Educational content only; this is not financial advice.
Sources
Related Articles

Nasdaq Sets a Record While the 10-Year Pushes 5.31%
Nasdaq closed at a record 27,477.31 (+1.1%) with the 10-year at 5.31%. S&P 7,773.95 (+0.7%), 0.3% from its high. ISM Services 54.9, prices paid 74.0. Brent $100.32. ES tagged 7834 late — inside the expected move. Levels for Tuesday inside.
Soft NFP. Soft Wage. Bookend Soft. Yields Bounced.
Soft NFP +29k / soft wage (wire only). Soft Claims 197k already on board. Cash green — S&P 7,722.72 (+0.7%), Dow 51,176.96 (+0.5%), Nasdaq 27,190.86 (+1.2%), Russell 2,832.90 (+0.9%). AP 10Y below 5.17% → 5.28%. Spotter GC 4184.2 / SI 60.95 / 10Y 5.243 / 6E 1.13; late HG 6.5775. Soft bookend closed.
Soft Claims. Yields Flipped. Modest Green. NFP Ahead.
Soft Claims printed 197k (wire only). Cash modest green — S&P 7,666.45 (+0.2%), Dow 50,926.56 (<0.1%), Nasdaq 26,871.60 (<0.1%), Russell 2,806.63 (+0.3%). AP 10Y near 5.34% → 5.24%. Spotter NQ h1 30606; late SI 61.21 / MBT 84990. NFP Fri still ahead.