Gold Traveled From One UW to the Next. The Alert Made the Location Actionable.
Gold sold from a 4,460.9 bearish hourly untested wick into a 4,392.6 bullish hourly UW. See how big levels, live Kahuna alerts, and defined risk turned the move into a repeatable trading lesson.
Tuesday, August 18, 2026
Most traders saw gold falling. PonoTrading members had something more useful: the level it left, the level it was approaching, and a live alert when price arrived.
Gold delivered today's cleanest example of why location matters more than constant prediction. A bearish one-hour untested wick near 4,460.9 marked the upper reaction area. Price then declined through the session and reached a separate bullish one-hour UW near 4,392.6. The PonoTrading Kahuna alert documented that lower tap at 9:57 a.m. HST / 3:57 p.m. ET, while the originating imbalance was still visible and measurable.
That does not mean every UW works. It does not mean an alert is an instruction to buy or sell. It means the trader no longer has to scan one chart on five time frames all day hoping to notice the right location. The system identifies the location; structure, risk, and execution still decide the trade.
The broader close reinforced the same lesson. Nasdaq futures finished about 1.7% below Monday's delayed reference, semiconductors carried the heaviest pressure, and the Nasdaq Composite lost 1.3%. Yet broad volatility remained controlled, the Dow lost only 0.2%, and gold's violent intraday move terminated at a pre-existing level rather than at a random number.
Closing Scorecard
| Market | Tuesday close / late reference | Session read |
|---|---|---|
| S&P 500 | 7,691.76 | -0.7%; third modest decline after Thursday's record |
| Nasdaq Composite | 26,289.71 | -1.3%; AI and semiconductor pressure led |
| Dow | 53,343.40 | -0.2%; relative resilience versus growth |
| Russell 2000 | 3,017.89 | -1.3%; weakness extended beyond mega-cap tech |
| ES futures | about 7,715.25 | -0.7% versus Monday's delayed reference |
| NQ futures | about 29,586.50 | -1.7%; session low near 29,514 |
| RTY futures | about 3,026.60 | -1.2%; finished near the lower portion of the range |
| VIX / VXN | about 15.84 / 22.54 | firmer, but not a disorderly fear event |
| WTI crude | about 84.09 | balanced after a wide intraday range |
| Gold futures | about 4,400 | sold from 4,460+ into the 4,392.6 UW area |
| 10-year yield | about 4.706% | eased from the opening area but remained elevated |
Cash-index values are official 4:00 p.m. ET closes reported by the Associated Press. Futures, volatility, dollar, crude, gold, and yield values are delayed closing references and may differ from official settlements or executable prices.
What the Morning Map Got Right
This morning's Market Pulse did not promise that daily -1SD would hold. It identified NQ near 29,688 as the decision line and required either a reclaim or accepted trade below it.
The cash session opened near that boundary, briefly traded above it, and then failed to establish a durable recovery. NQ eventually reached roughly 29,514 before finishing near 29,586.50. ES and RTY also lost their overnight references. That was confirmation of downside acceptance, not merely an excursion through a line.
The important distinction is sequence:
- The pre-open location created the question.
- The failed reclaim answered it.
- Cross-index weakness confirmed it.
- Controlled VIX and VXN readings argued for an orderly repricing rather than panic.
The plan worked because it defined evidence in advance. A level without confirmation is context. A level plus acceptance, breadth, and invalidation becomes a trade framework.
The Gold Trade: 4,460.9 to 4,392.6
Gold provided the day's most visual lesson.
The upper reference was a bearish one-hour untested wick at 4,460.9, originating from the 4,460.5-4,460.9 imbalance. Price interacted with that area and then delivered lower. The lower reference was a bullish one-hour UW at 4,392.6, tied to the 4,392.6-4,398.1 originating imbalance.
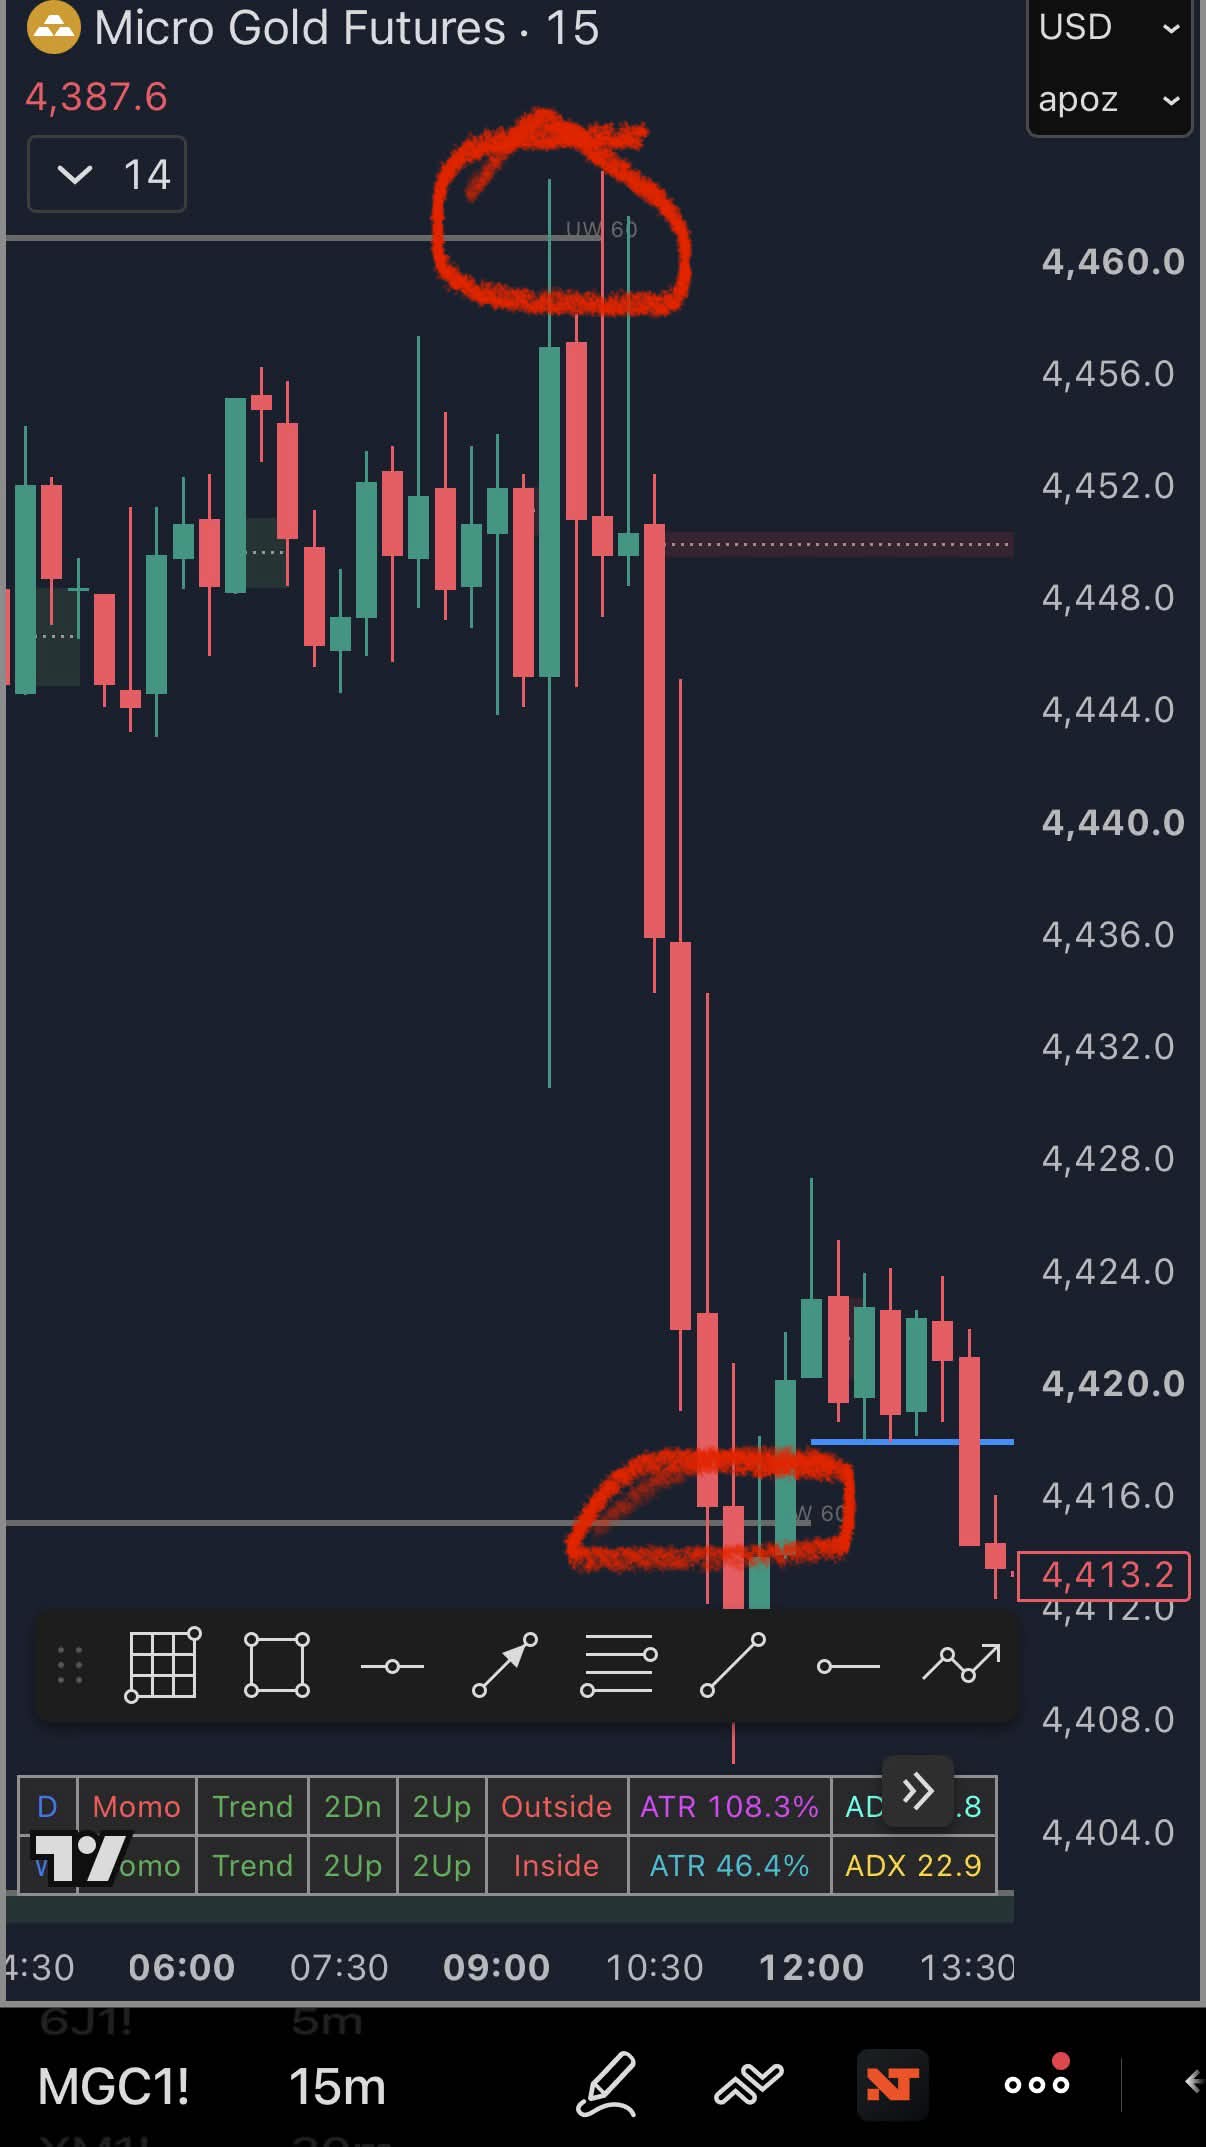
Michael summarized the move in Trader Chat as a gold short at the open, UW to UW. The chart showed the origin and destination before hindsight could turn the move into a vague story.
That is the core advantage of a mapped level: it gives the trader a place to evaluate risk and a logical destination for profit management. The edge was not knowing that gold must fall. It was recognizing that price had reacted at an upper imbalance and that a lower untested imbalance remained a plausible draw.
The Alert Did Not Replace the Trade Plan
At the lower level, the Kahuna system delivered the live alert:
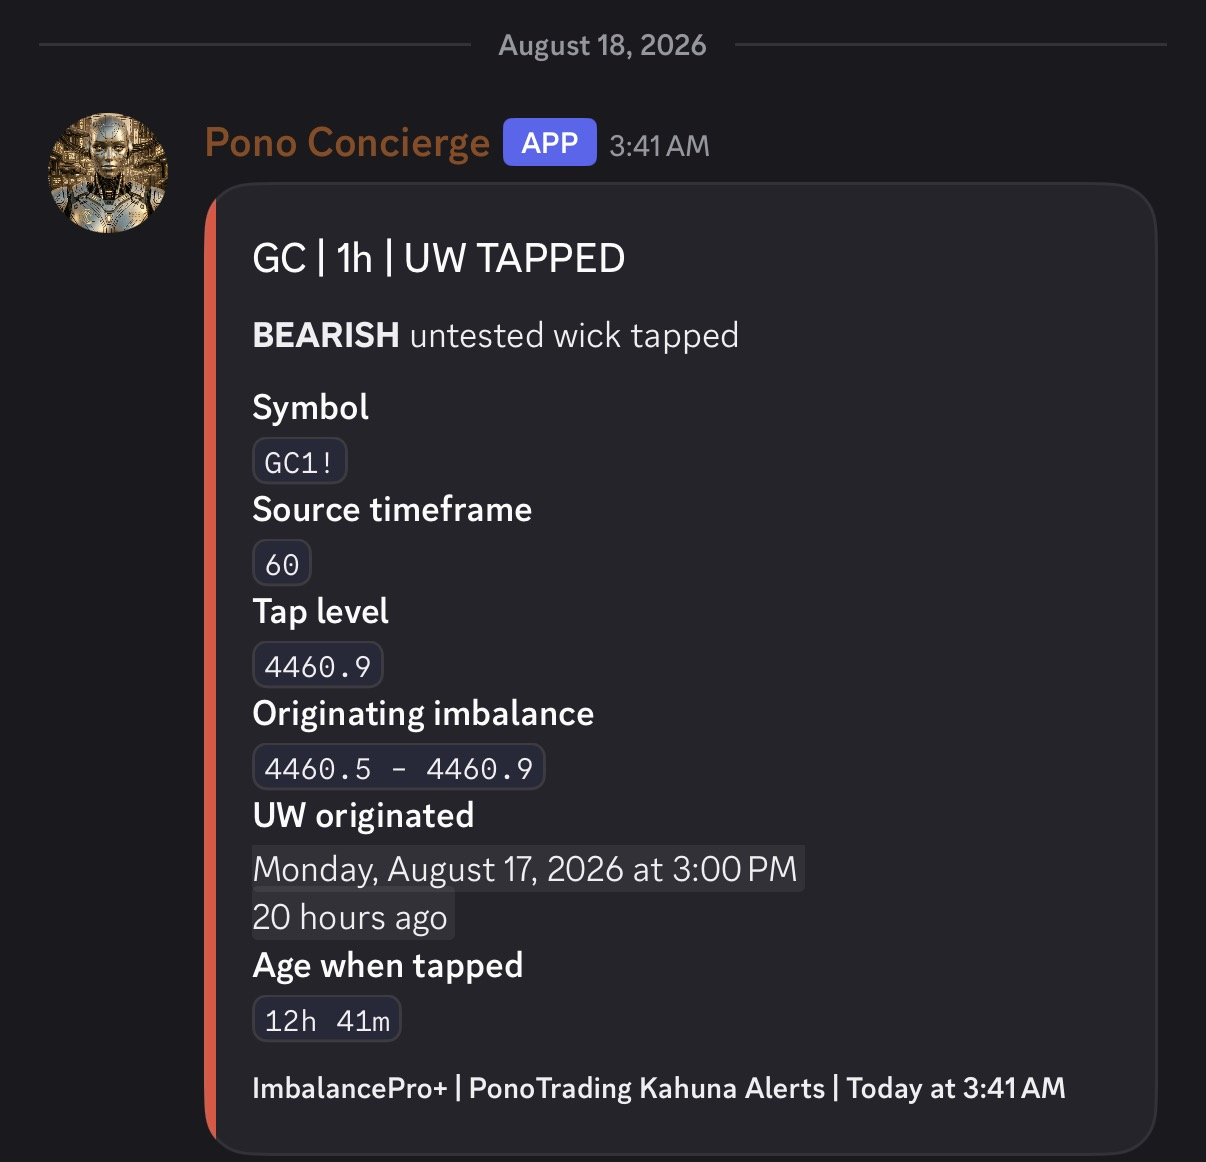
The alert supplied specific evidence:
- Instrument: GC continuous futures
- Source time frame: one hour
- Tap level: 4,392.6
- Originating imbalance: 4,392.6-4,398.1
- Directional context: bullish UW tapped
- Age: approximately four days and thirteen hours when touched
That precision matters, but the alert was not a guarantee. Price can touch a bullish UW and continue lower. A professional still needs an invalidation point, appropriate size, and confirmation that price is actually responding.
The workflow is therefore:
- Let the alert bring the location to you.
- Inspect the higher-time-frame context and nearby Big Levels.
- Require a reaction or structural confirmation appropriate to the setup.
- Size from the invalidation, not from the profit target.
- Take profit into the next mapped liquidity rather than assuming unlimited continuation.
Kahuna reduces monitoring friction. It does not remove trading risk.
Why Big Levels and UW Taps Work Better Together
Big Levels organize the auction into repeatable price increments. Untested wicks identify unfinished imbalances left by prior delivery. Neither tool should be treated as magic support or resistance.
Their value increases when they align because each answers a different question:
- Big Levels: Where is price likely to attract attention, liquidity, or profit-taking?
- UW taps: Where is an older imbalance being revisited for the first meaningful test?
- Kahuna alerts: When has price actually reached one of those locations across the monitored instruments and time frames?
- Price structure: Is the market reacting, accepting through the area, or invalidating the premise?
This is how traders stop pressing buttons in the middle of nowhere. They wait for price to reach a location with a defined reason to care.
The levels will not always work. That is precisely why risk management cannot be separated from the method. A trader can turn a profitable concept into a losing process by taking profits too early, adding to invalidated trades, or making one loss larger than several planned wins.
Nasdaq Closed Weak, but the Tape Was Not Panic
The Associated Press attributed Tuesday's weakness primarily to renewed selling in AI leaders. Micron fell about 7%, Nvidia lost 2.3%, and Broadcom declined 3.2%. The semiconductor ETF SMH finished roughly 4.1% below Monday's delayed reference, much weaker than equal-weight RSP at approximately -0.4%.
That concentration explains why NQ underperformed ES and the Dow. It also warns against describing the entire tape as indiscriminate liquidation. VIX finished near 15.84 and VXN near 22.54. Both rose, but neither confirmed a full volatility event.
For the next session, NQ must first recover 29,688-29,700, then prove it can hold above the zone that failed Tuesday. Below Tuesday's low near 29,514, downside acceptance remains intact. Between those references, traders should expect rotation and require a retest.
Tomorrow's Risk Gate
The Federal Reserve releases minutes from its July 28-29 meeting at 2:00 p.m. ET Wednesday. The July decision produced a three-member dissent in favor of a rate increase, making the inflation and policy discussion unusually important.
Before the minutes, the market can trade normally but should not confuse quiet conditions with absent event risk. Reduce exposure that cannot survive a fast repricing in yields, the dollar, and growth equities.
Tomorrow's operating map:
- NQ recovery: reclaim 29,688-29,700, hold the retest, and see SMH participate.
- NQ continuation: reject the reclaimed boundary and accept below 29,514.
- Gold response: evaluate whether 4,392.6 produces sustained response or whether price accepts through the UW.
- Event discipline: avoid carrying undefined risk into the 2:00 p.m. FOMC-minutes release.
The PonoTrading Take
A good alert does not tell you what to think. It tells you exactly when it is time to think.
Today's gold move traveled from one documented hourly UW to another. The upper level framed the short location. The lower level framed the destination and the next decision. Kahuna delivered the tap without requiring a trader to stare at gold across multiple time frames all session.
That is the real promise of the system: fewer random decisions, more attention at meaningful locations, and a repeatable process for defining risk.
Not every level holds. Not every alert becomes a trade. But when Big Levels, UW taps, structure, and risk align, the trader is finally making a decision where the market has already supplied a reason to care.
Put the Alerts to Work
Kahuna brings PonoTrading's premium alert system, Big Levels, advanced indicators, trade-management tools, and the broader trading workflow into one membership. Use the alerts to reduce screen time, then apply confirmation and defined risk when price reaches the location.
Explore Kahuna and the premium alert system
Bottom Line
Tuesday's index close was led lower by AI and semiconductor pressure: the S&P 500 fell 0.7%, the Nasdaq Composite lost 1.3%, and NQ futures finished near 29,586.50 after accepting below the morning 29,688 decision line.
Gold supplied the more durable trading lesson. Price reacted near the 4,460.9 bearish hourly UW, traveled into the 4,392.6 bullish hourly UW, and triggered a timestamped Kahuna alert at the destination. The move did not prove that UWs are guaranteed. It showed how mapped levels, live alerts, and disciplined execution can replace random entries with defined decisions.
The alert found the location. The trader still had to manage the risk.
Market observations were captured through approximately 4:50 p.m. ET on Tuesday, August 18, 2026. Cash-index values are official closing figures; futures and cross-asset values are delayed references. The trade example is educational and documents one historical sequence, not a promise of future results. Alerts and indicators do not guarantee profitable trades. Futures involve substantial risk and this is not financial advice.
Sources
- Associated Press: Sinking AI stocks pull Wall Street further from its record
- Associated Press: How major U.S. stock indexes fared Tuesday
- Federal Reserve: August 2026 calendar
- Federal Reserve: July 28-29, 2026 policy statement
- Yahoo Finance delayed market data
- Timestamped PonoTrading Trader Chat posts and Kahuna alert records, August 18, 2026
Related Articles
Soft NFP. Soft Wage. Bookend Soft. Yields Bounced.
Soft NFP +29k / soft wage (wire only). Soft Claims 197k already on board. Cash green — S&P 7,722.72 (+0.7%), Dow 51,176.96 (+0.5%), Nasdaq 27,190.86 (+1.2%), Russell 2,832.90 (+0.9%). AP 10Y below 5.17% → 5.28%. Spotter GC 4184.2 / SI 60.95 / 10Y 5.243 / 6E 1.13; late HG 6.5775. Soft bookend closed.
Soft Claims. Yields Flipped. Modest Green. NFP Ahead.
Soft Claims printed 197k (wire only). Cash modest green — S&P 7,666.45 (+0.2%), Dow 50,926.56 (<0.1%), Nasdaq 26,871.60 (<0.1%), Russell 2,806.63 (+0.3%). AP 10Y near 5.34% → 5.24%. Spotter NQ h1 30606; late SI 61.21 / MBT 84990. NFP Fri still ahead.
Soft Core. Hard Yield. Mixed Cash. NFP Ahead.
Soft Core PCE printed (+0.2% / +3.0%). Cash mixed — S&P 7,651.54 (−0.3%), Dow 50,906.05 (−0.9%), Nasdaq 26,861.06 (+0.2%). AP 10Y morning 5.20% → 5.29%. Spotter 10Y h1 5.258; YM Daily+Weekly 51443; GC cash bull 4181.2. Soft Claims Thu; NFP Fri still ahead.