The Weekly Dealing Range Median: The One Level That Caught the Low to the Tick
Today NQ tagged a projected level to the exact tick and reversed. That level wasn't Fibonacci. It wasn't a moving average. It was the Weekly Dealing Range Median — the most underused level in retail trading.
The Setup Nobody Was Watching
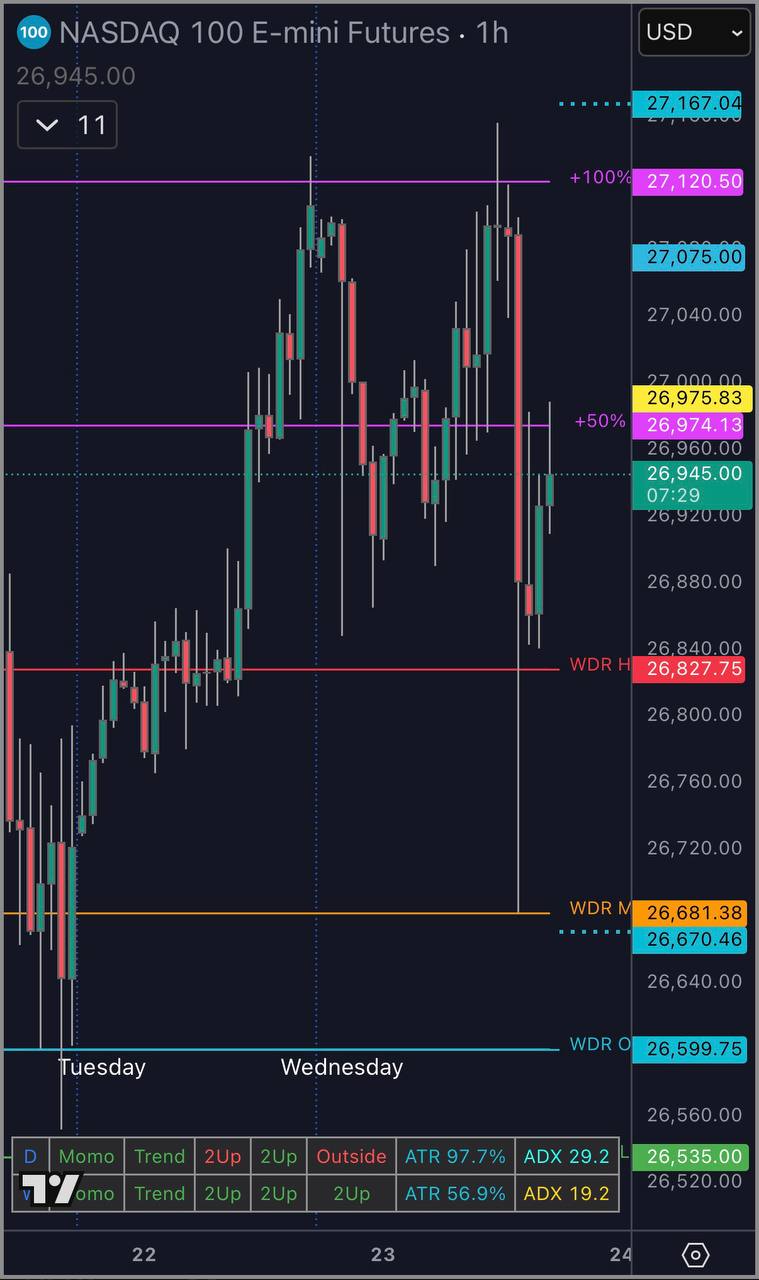
On April 23, 2026, NQ (Nasdaq 100 E-mini futures) put in a textbook outside-day reversal. Mon/Tue/Wed had stacked three consecutive higher highs. The tape looked one-directional, the late buyers were comfortable, and the sentiment feeds were bullish.
Then today opened strong, pushed another higher high, and flushed.
Not a slow bleed — a full-range flush from 27,120 down to 26,681.38.
That number matters. It's the exact tick where price stopped, reversed, and walked back above the midpoint of today's own range before settling.
It wasn't a coincidence. It was the Weekly Dealing Range Median doing its job.
What the WDRM Actually Is
The Weekly Dealing Range Median (WDRM) is a single horizontal level derived from a single day's price action — Monday's range.
The formula is almost insultingly simple:
WDRM = (Monday's High + Monday's Low) / 2
That's it. The midpoint of the first session's range, projected flat across the entire week.
No moving averages. No Fibonacci ratios. No higher-timeframe voodoo. Just the body of the first session, and a line through its center.
Why Monday
Monday sets the week's tone. It's the first full session after weekend news digestion, the first time weekly options positioning gets tested, and the first opportunity for dealers to establish hedges against the fresh weekly gamma profile.
The high and low Monday prints become the week's first reference points. Everything that happens Tuesday through Friday is, in part, a negotiation around those two levels — and by extension, the midpoint between them.
That midpoint is the spine of the week.
What the WDRM Tells You
1. Regime Classification
- Price above WDRM → you're in the premium half of the weekly range. Dealers are short gamma on the way up, sellers are absorbing, and rallies require continuation effort.
- Price below WDRM → you're in the discount half. Rallies get sold more easily; dips get bought more willingly; dealer hedging works in your favor on longs.
Knowing which half you're in tells you whether to look for continuation or mean reversion — before you look at any indicator.
2. Magnet Behavior
The WDRM is a liquidity magnet. When price extends far above or below it, open interest clusters form on both sides of the level. Market makers' net delta exposure incentivizes them to hedge back toward neutral — which means hedging back toward the median.
You see this every week: price rips away from WDRM on Tuesday, then grinds back to it by Thursday or Friday.
3. Reversal Pivot
When price is trending away from the WDRM and then reverses back into it, the WDRM becomes a textbook support/resistance flip. The level that was a target becomes a shelf.
Today's NQ session is the clearest possible example:
- Three days of higher highs = price pushing away from WDRM on the upside
- Outside candle today = a full-range flush back down
- Tag of 26,681.38 = WDRM to the tick
- Bounce + reclaim of today's intraday midpoint = classic "rejection from the spine of the range"
How to Mark the WDRM Like a Pro
There are three ways to get the WDRM on your chart:
- Manual horizontal line. After Monday's RTH close, take (High + Low) / 2 and draw a flat line. Extend it to end of week. Done in 15 seconds. Works on any platform.
- TradingView Pine indicator. A 10-line script can auto-plot Monday's range high, low, and median every week. Set it, forget it.
- Pay attention to WDR H / WDR M / WDR L labels. If you're watching our charts, those are the three levels being plotted — Weekly Dealing Range High, Median, and Low, derived from Monday's session.
Rules of Engagement
Three rules we teach members around the WDRM:
Rule 1: Always Know Which Side You're On
Before you take any directional trade intraweek, ask: am I above or below the WDRM right now?
If you're above it and you're planning a short, you're counter-trend relative to the weekly regime. That trade needs a much stronger thesis (e.g., rejection of WDR High, major supply, news catalyst).
If you're below it and you're planning a long, same deal — you're fighting the weekly structure unless there's a reason to.
Rule 2: Respect the Tag
When price first returns to the WDRM after trending away from it, treat the level as live support/resistance, not as a target to blow through. The first tag is almost always a reaction point, not a breakpoint.
What you want to see:
- Price arrives at WDRM with effort (velocity, volume, emotion)
- First candle into the level shows rejection (wick, reversal body, absorption)
- Return above/below the prior session's midpoint on the reclaim
All three → you have a high-probability reversal trade with the WDRM as your stop reference.
Rule 3: Don't Marry It
If price closes meaningfully through the WDRM — a full-hour close, not a wick — the regime has shifted. The upper half and lower half of the range have traded places. Adapt or get run over.
The WDRM is a powerful level. It is not a religion.
What This Means for Tomorrow
As of the Thursday close, NQ has:
- Tagged WDRM to the tick and reversed
- Reclaimed the midpoint of today's own range
- Left a clean outside-day signature on the daily chart
Friday's decision point is whether we continue the bounce back toward the Monday High / WDR H zone around 26,828, or fail the reclaim and retest the WDRM for a second time. A second clean bounce confirms the level and sets up next week's range. A failure through it opens the door to the Monday Low / WDR O level at 26,599.75.
Either way, you don't need to guess — you just need to know where the spine is and let price tell you which side of it you're on.
The Takeaway
Every week has a dealing range. Every dealing range has a midpoint. That midpoint is the most boring, most predictable, and most consistently respected level on the chart.
Retail traders chase moving averages. Professionals mark the midpoint.
Tag it. Stop guessing.
Want this level auto-plotted on every chart you open, along with WDR High and WDR Low? That's exactly what our members get. Join PonoTrading and start trading the spine of the range.
Written by
PonoTrading Team
PonoTrading publishes futures trading education, market structure notes, expected move analysis, and practical indicator workflows for retail traders.
Related Articles
How to Set Up NinjaTrader & Connect Your PonoTrading Indicators
Learn how to create a free NinjaTrader account, download NinjaTrader 8, install the platform, and connect your PonoTrading indicators the right way.
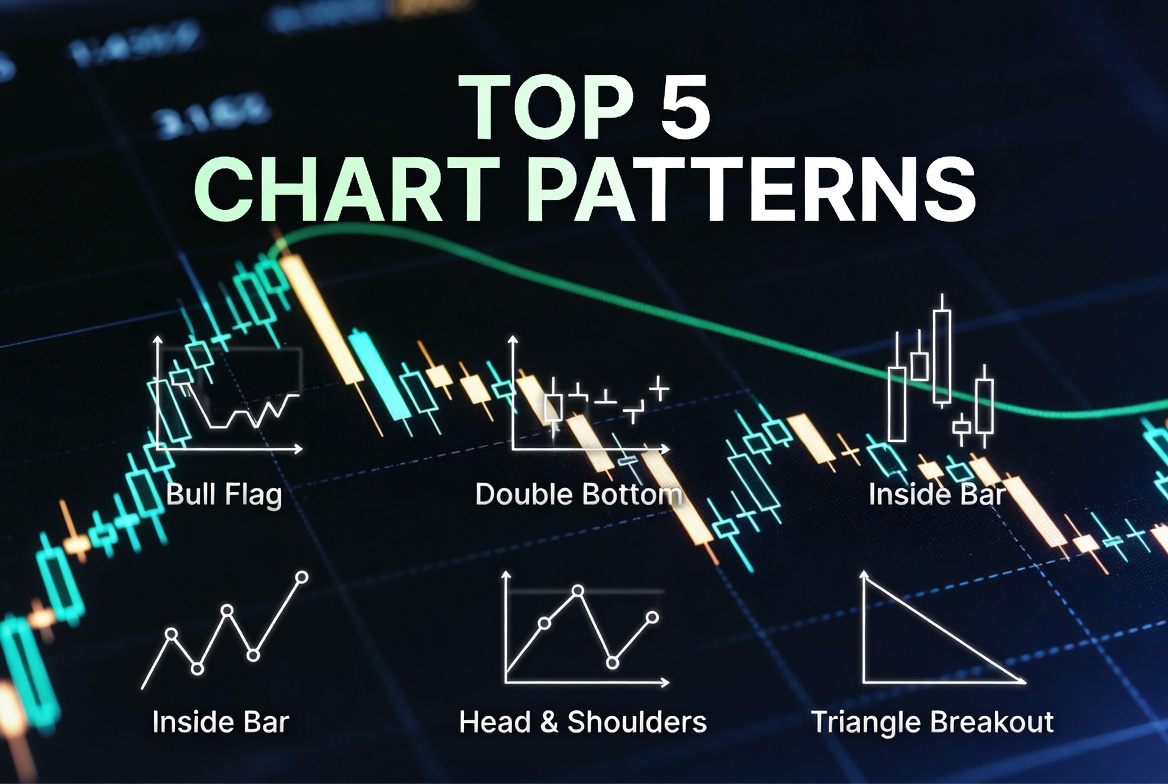
5 Price Action Patterns Every Day Trader Should Know
Master these five essential price action patterns to identify high-probability trading setups and improve your win rate in any market condition.