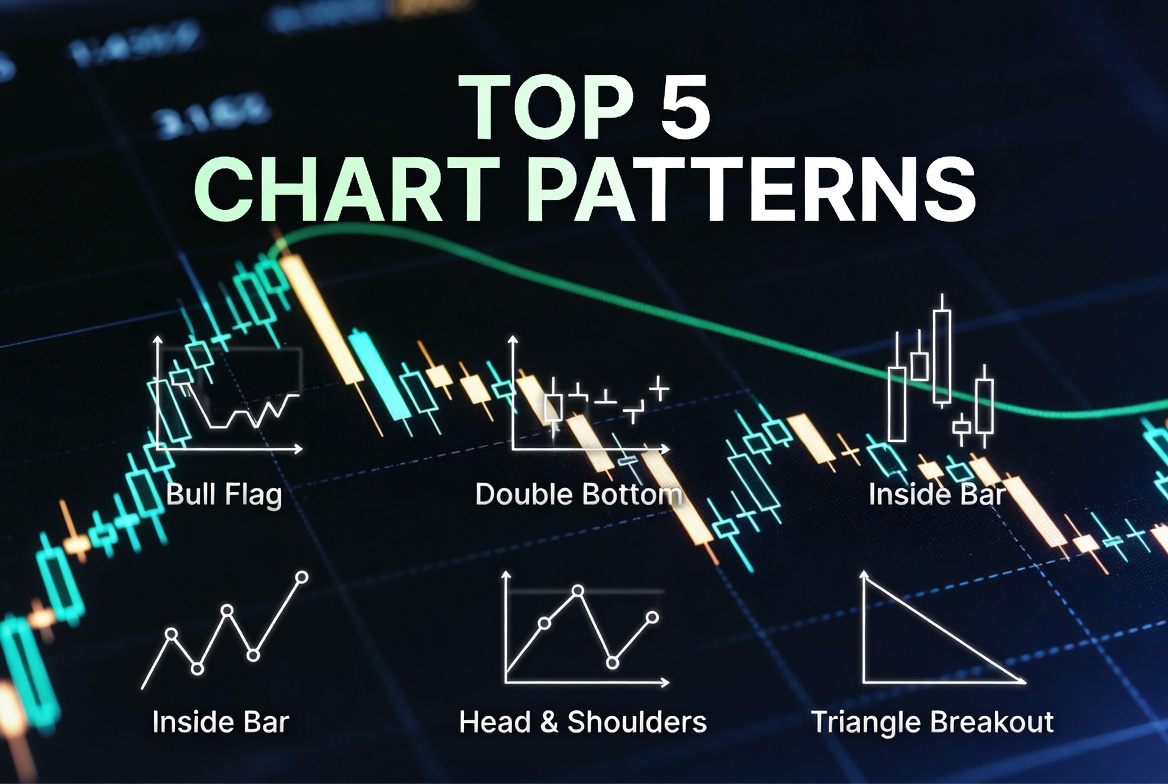
5 Price Action Patterns Every Day Trader Should Know
Master these five essential price action patterns to identify high-probability trading setups and improve your win rate in any market condition.
Introduction
Price action trading is the foundation of successful day trading. While indicators can be helpful, the raw movement of price tells the most honest story about market sentiment and momentum. In this guide, we'll cover five essential price action patterns that every day trader should have in their toolkit.
1. The Bull Flag Pattern
The bull flag is one of the most reliable continuation patterns in trending markets. It occurs when price makes a strong move higher (the flagpole), followed by a tight consolidation or slight pullback (the flag).
How to Trade It:
- Wait for a strong upward move with volume
- Look for price to consolidate in a tight range
- Enter on the breakout above the flag high
- Place stop below the flag low
- Target: Height of the flagpole added to breakout point
Why It Works: The flag represents profit-taking from the initial move. When buying pressure returns, weak hands have already exited, creating a clean breakout with less resistance.
2. The Double Bottom Reversal
A double bottom signals the end of a downtrend and the beginning of a new uptrend. Price tests a support level twice, fails to break lower, and then reverses with conviction.
Key Characteristics:
- Two distinct lows at approximately the same price level
- Volume should be higher on the second low
- Confirmation comes when price breaks above the middle peak (neckline)
Trading the Pattern:
- Identify the two bottoms forming at support
- Wait for the neckline break with strong volume
- Enter on the breakout or on a pullback retest
- Stop loss: Below the second bottom
- Target: Distance from bottom to neckline, projected from breakout
3. The Inside Bar Setup
Inside bars are powerful continuation patterns that signal consolidation before the next move. An inside bar is a candle whose high and low are completely contained within the previous candle's range.
Why Traders Love Inside Bars:
- They represent compression and indecision
- Often precede explosive moves
- Clear entry and stop placement
- Work on all timeframes
How to Trade Inside Bars:
- Find an inside bar after a strong directional move
- Enter on a break of the inside bar's high (for long) or low (for short)
- Stop: Opposite side of the inside bar
- Look for confluence with support/resistance levels
4. The Head and Shoulders Pattern
This classic reversal pattern signals trend exhaustion and potential reversal. While it takes longer to develop than other patterns, it offers excellent risk-to-reward setups.
Pattern Structure:
- Left Shoulder: Initial rally that fails
- Head: Higher rally that also fails
- Right Shoulder: Final rally that fails at lower high
- Neckline: Support drawn connecting the lows
Trading Strategy:
- Wait for neckline break with conviction
- Enter short on break or pullback retest
- Stop above right shoulder
- Target: Height of head projected down from neckline
5. The Triangle Breakout
Triangles (ascending, descending, symmetrical) represent equilibrium between buyers and sellers. The breakout direction often continues the prior trend, but can also signal reversals.
Types of Triangles:
- Ascending Triangle: Flat top, rising lows (bullish)
- Descending Triangle: Flat bottom, lower highs (bearish)
- Symmetrical Triangle: Converging trendlines (breakout direction uncertain)
How to Trade Triangles:
- Draw trendlines connecting the highs and lows
- Wait for a decisive break with volume
- Enter on breakout or pullback to broken trendline
- Stop: Inside the triangle, below the last swing low/high
- Target: Widest part of triangle projected from breakout
Putting It All Together
These five patterns form the foundation of price action trading. Here are tips for using them effectively:
Confluence Is Key: Look for patterns forming at major support/resistance levels, round numbers, or previous swing points.
Volume Confirmation: Breakouts with strong volume are more likely to follow through. Weak volume often leads to false breakouts.
Multiple Timeframe Analysis: Confirm patterns on higher timeframes. A bull flag on the 5-minute chart is stronger if the 1-hour chart shows an uptrend.
Risk Management: Always use stop losses. Even the best patterns fail sometimes. Position sizing protects your capital.
Conclusion
Mastering these five price action patterns will dramatically improve your ability to read market structure and identify high-probability setups. Start by focusing on one pattern at a time. Practice identifying it on historical charts, then paper trade it before risking real capital.
Remember: Price action is the language of the market. The more fluent you become, the better trader you'll be.
Ready to take your trading to the next level? Explore our premium indicators and education courses designed for serious traders.
Written by
PonoTrading Team
PonoTrading publishes futures trading education, market structure notes, expected move analysis, and practical indicator workflows for retail traders.
Related Articles

RTH Market Prep: the PonoTrading playbook
RTH Market Prep is the desk habit in front of the first click: overnight location, clocks, expected-move bands, key levels, remaining size, and when to stand down. It is not a signal and not a forecast.

Cake Before Icing: A Sustainable Framework for Growing a Prop-Trading Business
Secure personal needs, taxes, reserves, operating costs, and a repeatable process before using realized prop-trading results to fund additional accounts or complexity.
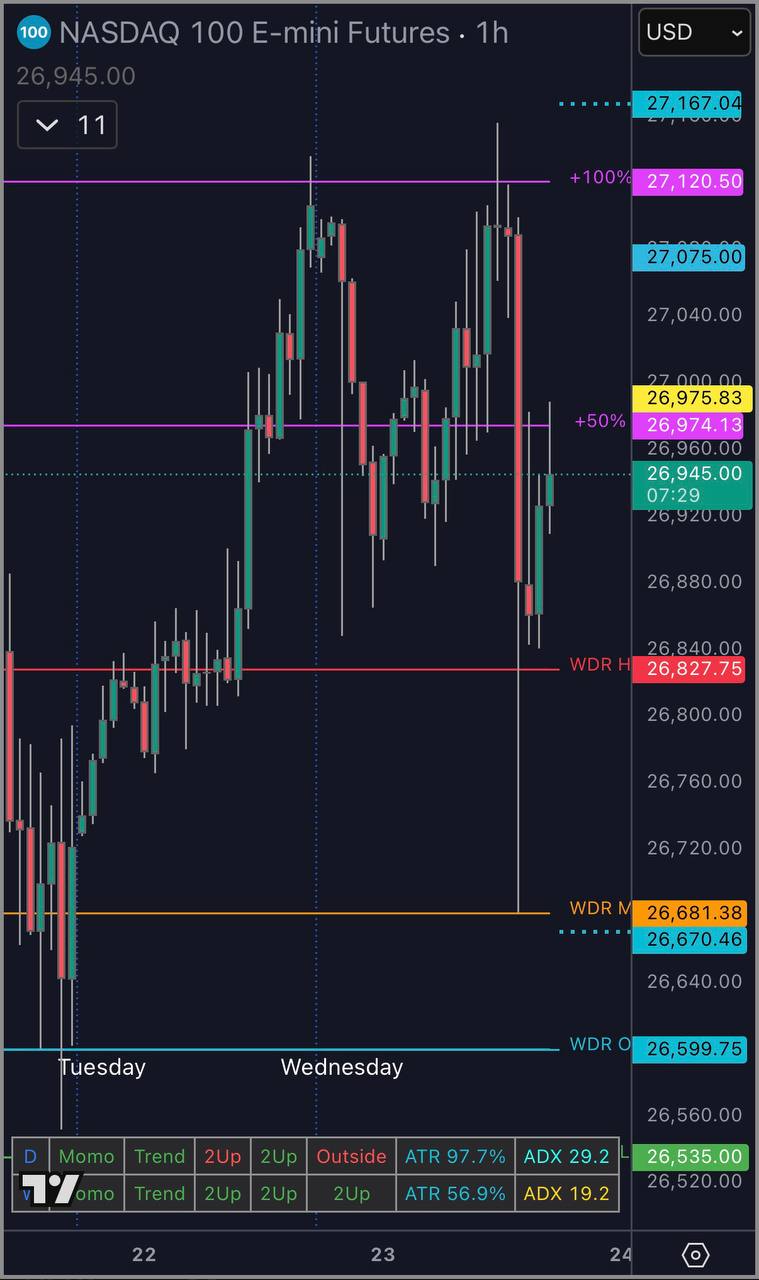
The Weekly Dealing Range Median: The One Level That Caught the Low to the Tick
Today NQ tagged a projected level to the exact tick and reversed. That level wasn't Fibonacci. It wasn't a moving average. It was the Weekly Dealing Range Median — the most underused level in retail trading.