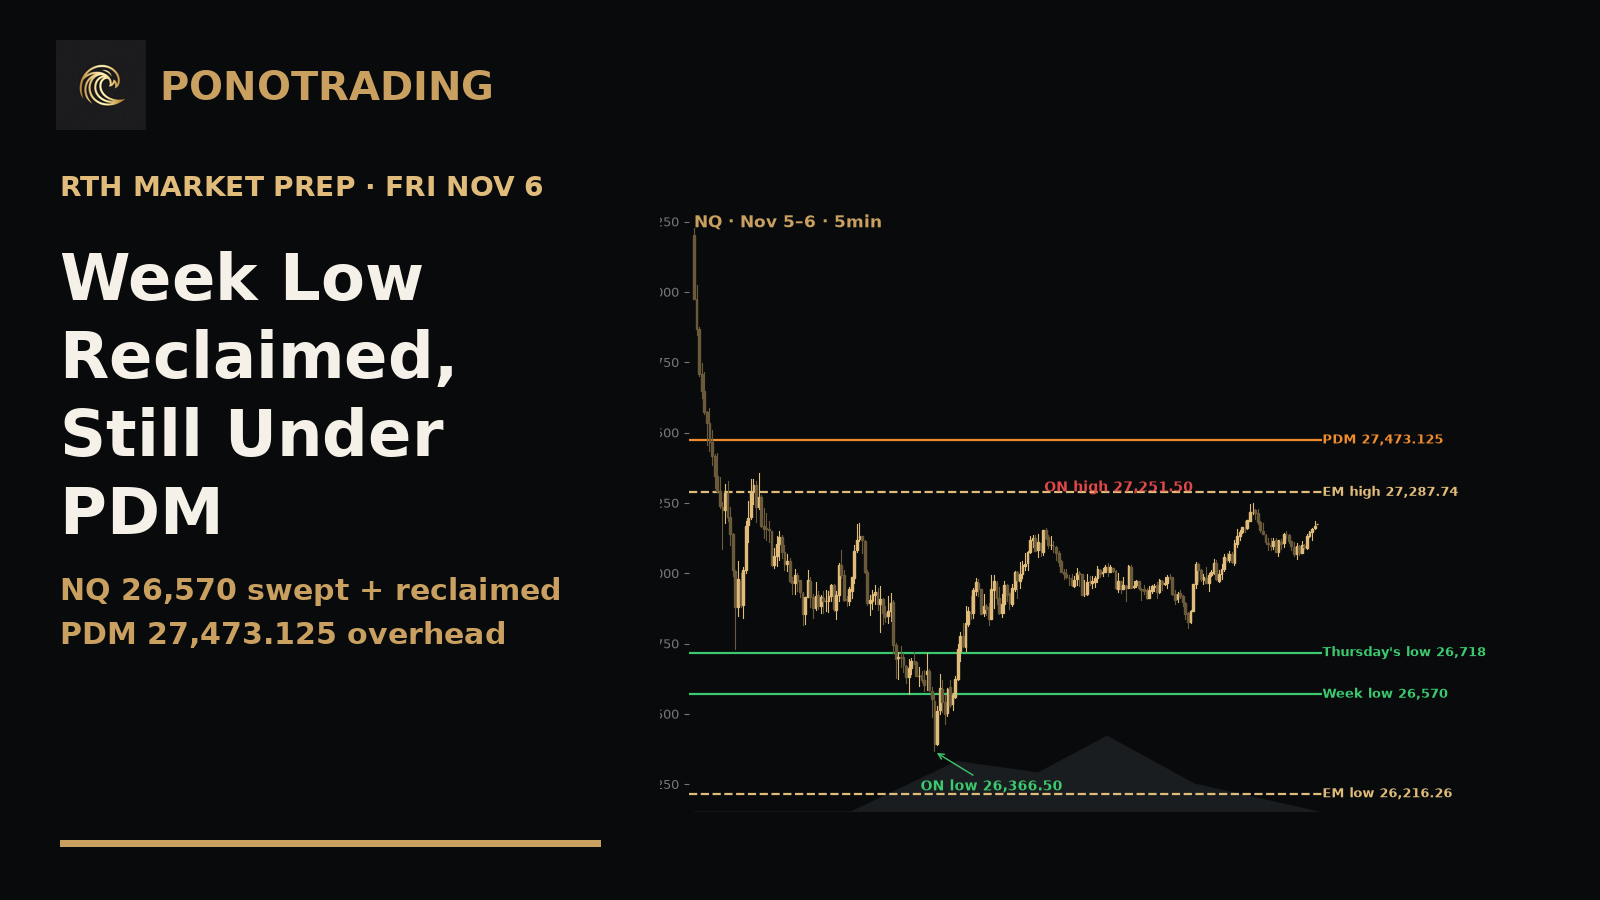
Week Low Reclaimed, Still Under PDM
NQ swept the week low at 26,570 and reclaimed it, but sits under its PDM at 27,473.125. Drop, base, drop holds until a daily close over 30,178. Expected move, 18 UW prints, 23 median tags.
Friday, November 6, 2026
Our expected move for NQ today runs from 26,216.26 to 27,287.74. The expected move is the range the options market is pricing for a set time. Overnight NQ stayed inside it, from a low of 26,366.50 to a high of 27,251.50, and sits near 27,176. ES is inside its band of 7,274.10 to 7,491.90. The band is wide because Thursday was a big down day across the whole board, and fear raises the price of options.
Here is the bigger picture. Thursday the whole market fell hard. NQ ran from 28,228.25 down to 26,718 in the regular session. Overnight it dipped under this week's low at 26,570, then got back over it. That is a failed breakdown: price breaks a low, can't stay under it, and climbs back. It is not a new uptrend. NQ is still under Thursday's middle and still far under October's low at 28,232.75. Support from earlier in the week is just a spot on the chart. In a downtrend, price can run through any level in its path.
Our frame for NQ is drop, base, drop. Price drops, goes sideways for a while (the base), then can drop again. That read stays until NQ closes a day above 30,178, the Oct. 28 high and last week's high. November is also a 2Down on NQ. A 2Down means price broke under last month's low. NQ did that when it lost 28,232.75.
From Thursday's 4:00 p.m. ET close to about 6:50 a.m. ET, the UW board sent 18 prints: 17 hourlies, 1 Daily, 0 Weekly. A UW print is an imbalance alert. It fires when price comes back to a level where buyers or sellers left a gap. MedianReclaim sent 23 median tags: 10 Daily and 13 Weekly. A median tag fires when price trades back to the middle of a day or week. These are taps on our levels. They tell you where price touched, not where it goes next.
After the bell and Asia: the low gets swept
What printed on our board. MedianReclaim tagged NQ's Daily median at 26541.75 at 6:19 p.m. ET, with the touch at 26366.5. ES tagged its Daily median at 7349.875 at 7:15 p.m. ET and at 7363 at 7:46 p.m. ET. RTY tagged its Daily median at 2726.95 at 7:32 p.m. ET. At 12:31 a.m. ET, ES got an hourly UW bull at 7373 and YM got one at 51067.
What price did. NQ made its overnight low at 26,366.50 at 6:19 p.m. ET, right after the reopen. That was under this week's low at 26,570. ES made its low at 7,322.25 at the same minute. Then both climbed. NQ's Asia high was 27,159.25 at 9:50 p.m. ET.
What we're watching because of it. The week low broke and did not hold as a new floor for sellers. That is the failed breakdown. YM did not get back over its week low.
London: higher, with the Dow lagging
What printed on our board. ES tagged its Daily median at 7369.625 at 2:12 a.m. ET. YM tagged its Daily median at 51230 at 4:07 a.m. ET. YM got an hourly UW bull at 51157 at 5:11 a.m. ET. That was the only new index UW print after London opened. NQ and RTY had no UW prints all night.
What price did. NQ dipped to 26,805 at 2:31 a.m. ET, then made its overnight high at 27,251.50 at 4:36 a.m. ET. ES made its high at 7,427.25 at the same time.
What we're watching because of it. NQ's overnight high sits just under the top of its expected move at 27,287.74. That is the first ceiling.
Overnight into New York: under the PDM
PDM means the prior day's median, the halfway point of the day before. NQ's PDM is 27,473.125: (28,228.25 + 26,718) ÷ 2. ES's PDM is 7,544.875: (7,712.50 + 7,377.25) ÷ 2. NQ near 27,176 is about 300 points under its PDM. ES near 7,408 is under its own. Getting back over a week low is a start. Getting over the PDM would be the next proof.
Overnight sweep
As of 6:36 a.m. ET. Thursday's levels are the regular session. Last week's include the overnight session.
ES traded back over Thursday's low at 7,377.25 by 50 points and is holding over it. It also took out this week's low at 7,346 by 23.75 points and got back above it. Overnight it traded from 46 points over to 59 points under Thursday's 4:00 close (+0.62% / -0.80%). It's 27 points over that close now at 7,408.25 (+0.37%). A low that gets swept and reclaimed is a failed breakdown until it proves otherwise. At the open: Hold 7,346 and the move back toward 7,427.25 is in play. Lose 7,322.25 and the sweep turns into acceptance.
NQ traded back over Thursday's low at 26,718 by 533.5 points and is holding over it. It also took out this week's low at 26,570 by 203.5 points and got back above it. Overnight it traded from 505 points over to 380 points under Thursday's 4:00 close (+1.89% / -1.42%). It's 429.5 points over that close now at 27,176 (+1.61%). A low that gets swept and reclaimed is a failed breakdown until it proves otherwise. At the open: Hold 26,570 and the move back toward 27,251.50 is in play. Lose 26,366.50 and the sweep turns into acceptance.
YM took out this week's low at 51,300 by 409 points and is holding under it. At the extreme it was 709 points under the close (-1.37%), and it's 435 under now at 51,165 (-0.84%). Back above 51,300 is the first thing that changes it.
RTY traded back over Thursday's low at 2,729.60 by 13.9 points and is holding over it. It also took out this week's low at 2,718.50 by 4.3 points and got back above it. At the extreme it was 20.9 points under the close (-0.76%), and it's 1.8 over now at 2,736.90 (+0.07%). Hold 2,718.50 and it's a failed breakdown.
The split: ES, NQ, and RTY reclaimed, YM is holding under. When part of the index board accepts lower and part reclaims, respect the weak side until it reclaims.
Crude dipped back under Thursday's high at 90.99 by 1.92 and got back over it. At the extreme it was 2.01 over the settle (+2.22%), and it's 0.48 over now at 91.00 (+0.53%).
Gold took out Thursday's low at 4,085.60 by 41.1 and is holding under it. It also dipped back under last week's high at 4,097.20 by 52.7 and is still under it. At the extreme it was 69 under the settle (-1.68%), and it's 32.5 under now at 4,081.00 (-0.79%).
New York setup: a bounce inside a drop
Think of our Key Levels as a risk map, not a forecast. They show where you are wrong fast. Today NQ sits between three of them. Overhead are the expected-move high at 27,287.74 and the PDM at 27,473.125. Under it are this week's low at 26,570 and the overnight low at 26,366.50.
So the job today is simple. If NQ holds over 26,570 and gets through 27,287.74 after the first 5-minute bar, the PDM at 27,473.125 is the next test. If NQ loses 26,366.50, the failed breakdown is gone and the low is accepted. The drop read stays either way until a daily close over 30,178.
The October jobs report comes out at 8:30 a.m. ET. That one report can move price right through our levels before the cash open. The cash open is 9:30 a.m. ET, which is 4:30 a.m. HT. Let the first 5-minute bar finish before you trust any break.
What the tools are saying
UW board: 17 hourlies, 1 Daily, 0 Weekly. Index prints were all hourly bulls: YM 51518 (4:01 p.m. ET), YM 51067 and ES 7373 (12:31 a.m. ET), and YM 51157 (5:11 a.m. ET). NQ and RTY had none. The one Daily print was on the British pound, not an index.
MedianReclaim: 10 Daily tags and 13 Weekly tags. Index Daily tags: NQ 26541.75, ES 7349.875, 7363 and 7369.625, RTY 2726.95, and YM 51230.
Daily Expected-Move Map
Verified from the house expected-moves publisher off the 2026-11-05 close. The settles and volatility closes match a second quote feed, and the bands recompute to the cent from that feed. The 2x band is twice the move. It is the outer frame for a day that runs far. Publisher alerts: 6 (ES, NQ, RTY and crude under their weekly bands, gold over its weekly band, NQ under its quarterly band).
| Contract | Anchor close | Daily expected move | Daily 2x band |
|---|---|---|---|
| ES | 7,383.00 | 7,274.10 – 7,491.90 (±108.90) | 7,165.20 – 7,600.80 |
| NQ | 26,752.00 | 26,216.26 – 27,287.74 (±535.74) | 25,680.52 – 27,823.48 |
| YM | 51,615 | 50,853.67 – 52,376.33 (±761.33) | 50,092.35 – 53,137.65 |
| RTY | 2,735.40 | 2,695.05 – 2,775.75 (±40.35) | 2,654.71 – 2,816.09 |
| GC | 4,113.50 | 4,057.89 – 4,169.11 (±55.61) | 4,002.27 – 4,224.73 |
| CL | 90.52 | 87.66 – 93.38 (±2.86) | 84.81 – 96.23 |
Vol (Thursday close): VIX 28.18 · VXN 38.26 · GVZ 25.83 · OVX 60.29
Weekly expected move (anchored Friday, Oct. 30): ES 7,409.23 – 7,818.77 (±204.77) · NQ 27,407.81 – 29,660.19 (±1,126.19).
Read it like this. NQ's whole overnight session stayed inside today's band. NQ is still under its weekly band low at 27,407.81, so the week has already run past what was priced for it.
Levels
All of our Key Levels live in one place.
- NQ: 30,178 swing high (Oct. 28, last week's high) · 28,232.75 October's low · 28,228.25 Thursday's high · 27,473.125 PDM · 27,407.81 weekly band low · 27,287.74 expected-move high · 27,251.50 overnight high · 26,752 Thursday's settle · 26,718 Thursday's low · 26,570 this week's low · 26,366.50 overnight low · 26,216.26 expected-move low
- ES: 7,712.50 Thursday's high · 7,544.875 PDM · 7,491.90 expected-move high · 7,427.25 overnight high · 7,383 Thursday's settle · 7,377.25 Thursday's low · 7,346 this week's low · 7,322.25 overnight low · 7,274.10 expected-move low
- YM: 51,300 this week's low (holding under) · 50,853.67 expected-move low
Thursday's high and low, last week's high, October's low and last year's levels come from our prior key levels tool. This year's open comes from our current key levels tool. The year levels are the big frame on the monthly chart, not today's map.
What we're doing
NQ: over the week low, under the PDM. Hold 26,570 and 27,251.50 to 27,287.74 is the first test. Over it and holding, 27,473.125 is next. Lose 26,366.50 and the sweep turns into acceptance.
ES: same shape. Hold 7,346 and 7,427.25 is the first test, then 7,491.90. Lose 7,322.25 and the reclaim is gone.
YM: the weak side. It is still under 51,300. Until YM gets back over it, respect the split and keep size small.
Where we're wrong. A daily close over 30,178 on NQ ends the drop-base-drop read. Nothing short of that changes the bigger picture. Inside the day, NQ back under 26,366.50 would tell us the bounce was only a pause.
One question for you. If the jobs report pushes NQ to the edge of its expected move before 9:30, where is your stop, and how much would you lose if it hits?
Know the range before the bell
A failed breakdown, a wide band, and the 30,178 line far overhead. The PonoTrading Expected Move indicator draws the daily, weekly and monthly bands on your chart. The alerts we counted here land in the free PonoTrading Discord prep room.
Sources
- Sent UW and MedianReclaim receipts, Thursday 4:00 p.m. ET to about 6:50 a.m. ET Friday
- House expected-moves publisher: dry-run off the 2026-11-05 close, settles and volatility closes matched against a second quote feed
- Thursday's levels, this week's and last week's levels, October's low and the overnight highs and lows: two price feeds of front-month futures bars
- Economic calendar: the Bureau of Labor Statistics schedule lists the October Employment Situation at 8:30 a.m. ET Friday
Let the alert get your attention, then look left. If the chart doesn't back it up, let it go.
Educational content only. Not investment advice. Futures trading involves substantial risk of loss. Past performance is not indicative of future results. Verify all levels on your own feed before sizing.
Related Articles
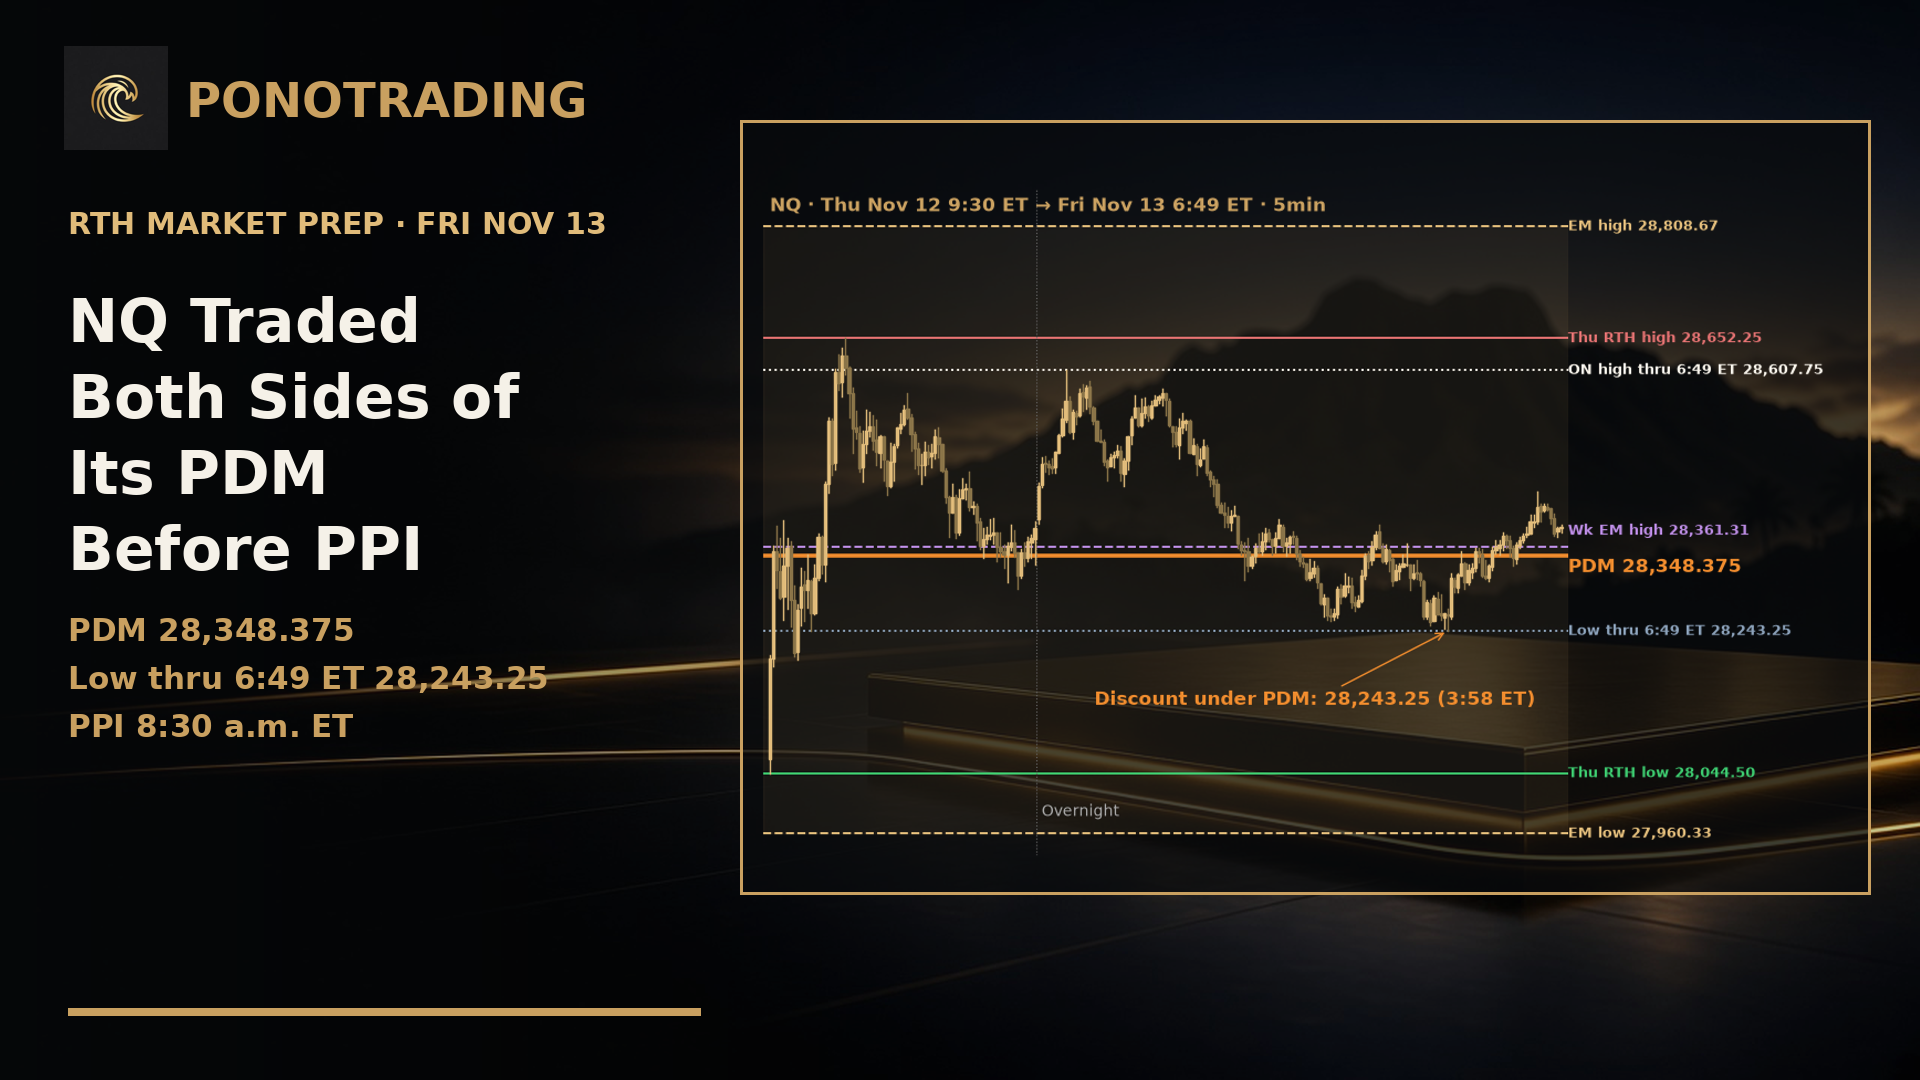
NQ Traded Both Sides of Its PDM Before PPI
NQ and ES both traded on both sides of their PDMs overnight. NQ's PDM is 28,348.375; ES's is 7,628.125. PPI comes out at 8:30 a.m. ET.
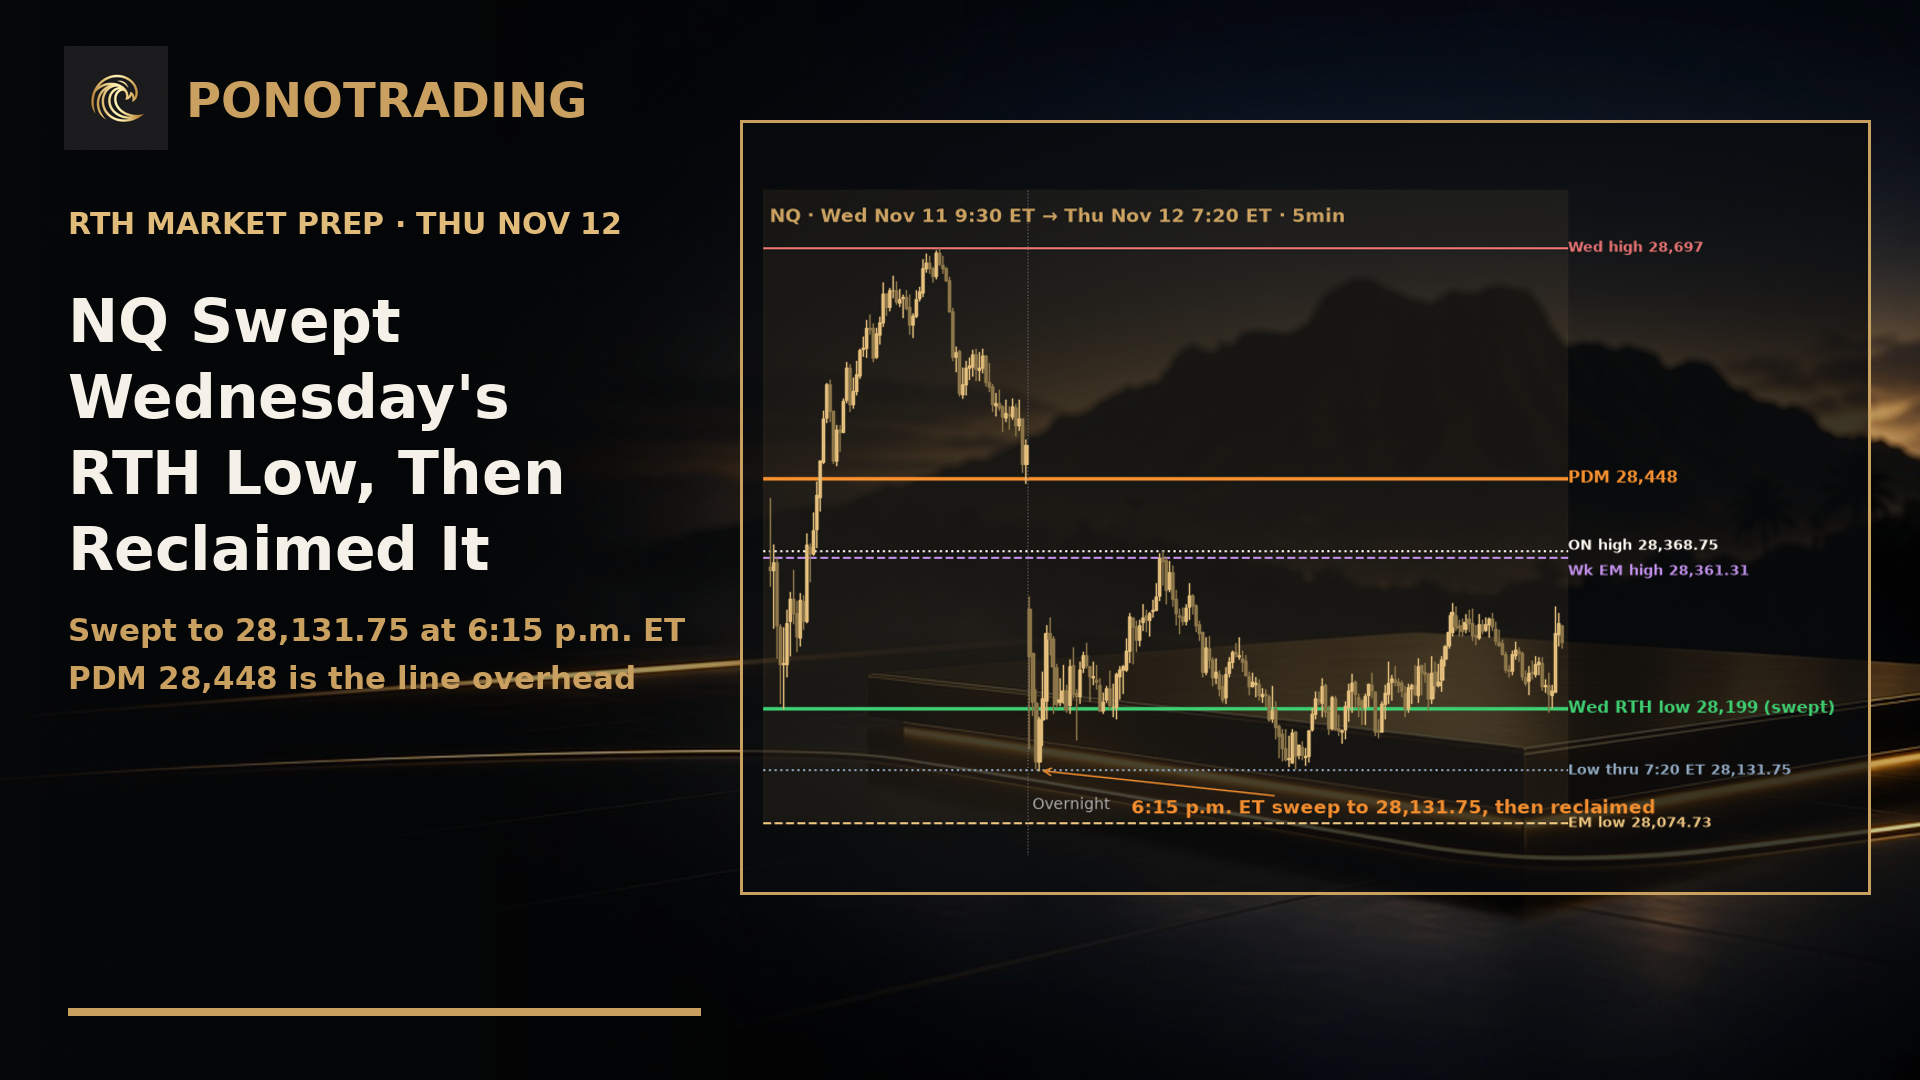
NQ Swept Wednesday's RTH Low, Then Reclaimed It
NQ swept Wednesday's RTH low at 28,199 at the reopen after Nvidia news, then reclaimed it. Its PDM at 28,448 is overhead. Claims at 8:30 a.m. ET.
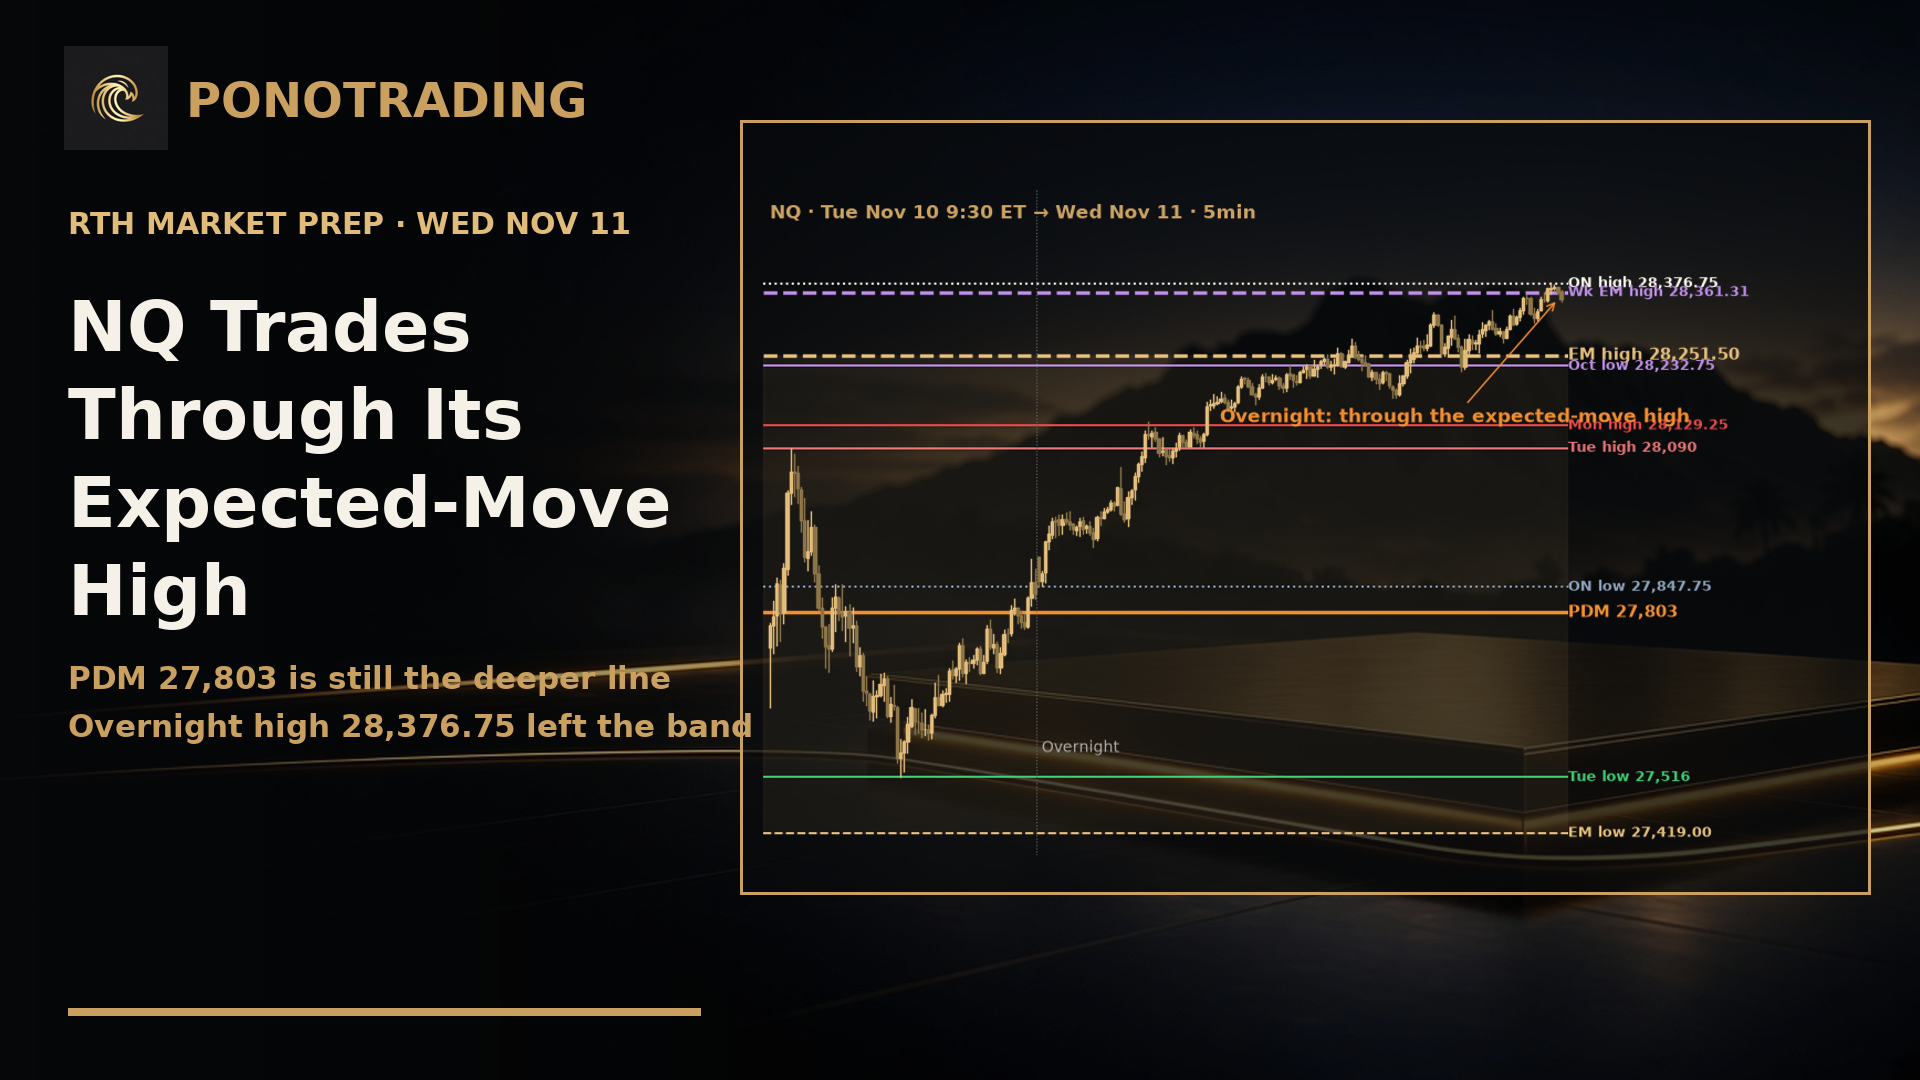
NQ Trades Through Its Expected-Move High
NQ traded through its expected-move high at 28,251.50 overnight and holds over its PDM at 27,803. ES is still inside its band. Veterans Day open.