Prior Week OHLMC Pro+ Indicator for TradingView
Identify high-probability pivot levels from the prior trading week. Learn how to use this powerful TradingView tool to improve your analysis.
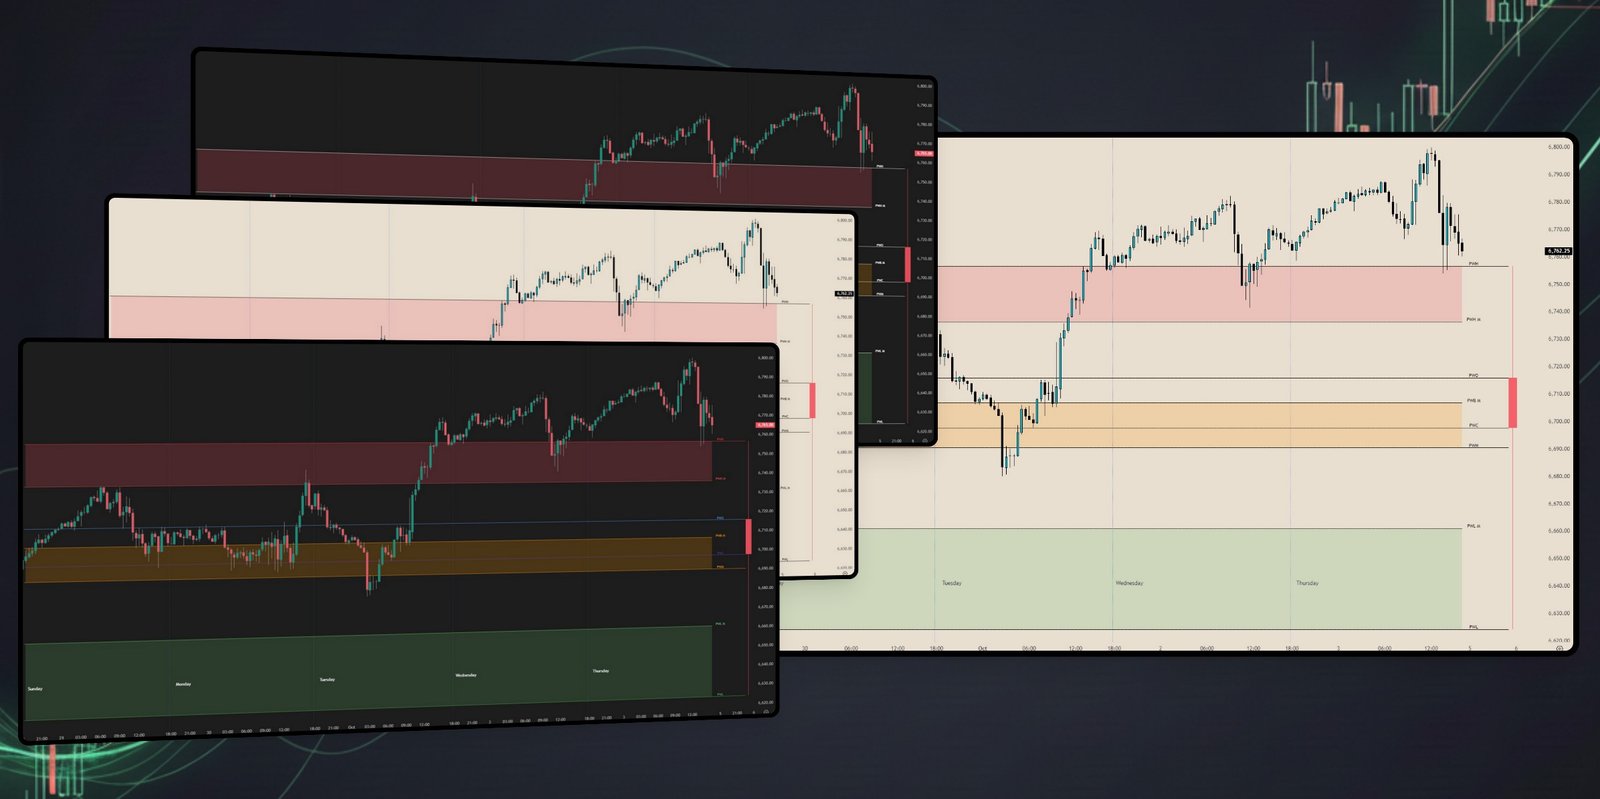
Shown on TradingView
What it Does
This indicator is a tool designed to indicate where price has demonstrated significant activity during the previous trading week. It plots key price levels - Open, High, Low, Close, and Median - along with strong support and resistance zones as well as mean reverting zones. This detailed page contains at least 300 words.
Key Features
- Plots prior week's Open, High, Low, Close, and Median levels.
- Shows body center (midpoint).
- Displays upper and lower midpoint (M) levels for initial reactions.
- Optional zone highlighting for enhanced visual analysis.
- Customizable labels and color schemes.
- Clean presentation focused on actionable information.
How to Use This Indicator
The effectiveness of any key level depends on multiple factors: the number of times price has interacted with that level, the distance price traveled between tests, and the time elapsed since the last interaction. These variables combined help build a case for potential trade setups.
These weekly levels and zones provide reference points where price commonly pivots - sometimes multiple times within a single week. Depending on market conditions, this can facilitate mean reversion strategies when price remains within the prior week's range. During breakout weeks, price often retests the median level/zone before continuation, or in cases of strong momentum, retests the prior week's high/low zones.
Professional Insights
Study of these levels reveals patterns in how price behaves around institutional reference points. The indicator provides insights into likely price behavior as the week progresses, based on how price travels between these established levels and zones.
Systematic Approach
Regular observation of price action at these weekly levels can inform the development of systematic trading approaches. When combined with proper risk management and confluence from other timeframes, these levels serve as objective reference points for trade planning.
This tool complements our Monthly and Yearly versions for traders seeking comprehensive multi-timeframe analysis. The levels represent actual market memory zones where significant activity has occurred, providing a factual foundation for technical analysis.
Get Prior Week OHLMC


Choose your plan
All sales are final - I can cancel anytime and will retain access until the end of the current billing period.
Haumana — includes Prior Week OHLMC and more. Get all indicators + alerts + community.