Prior Year OHLMC Pro+ Indicator for TradingView
Leverage the most significant market memory zones with prior year key levels. Learn how to use this institutional-grade indicator for TradingView.
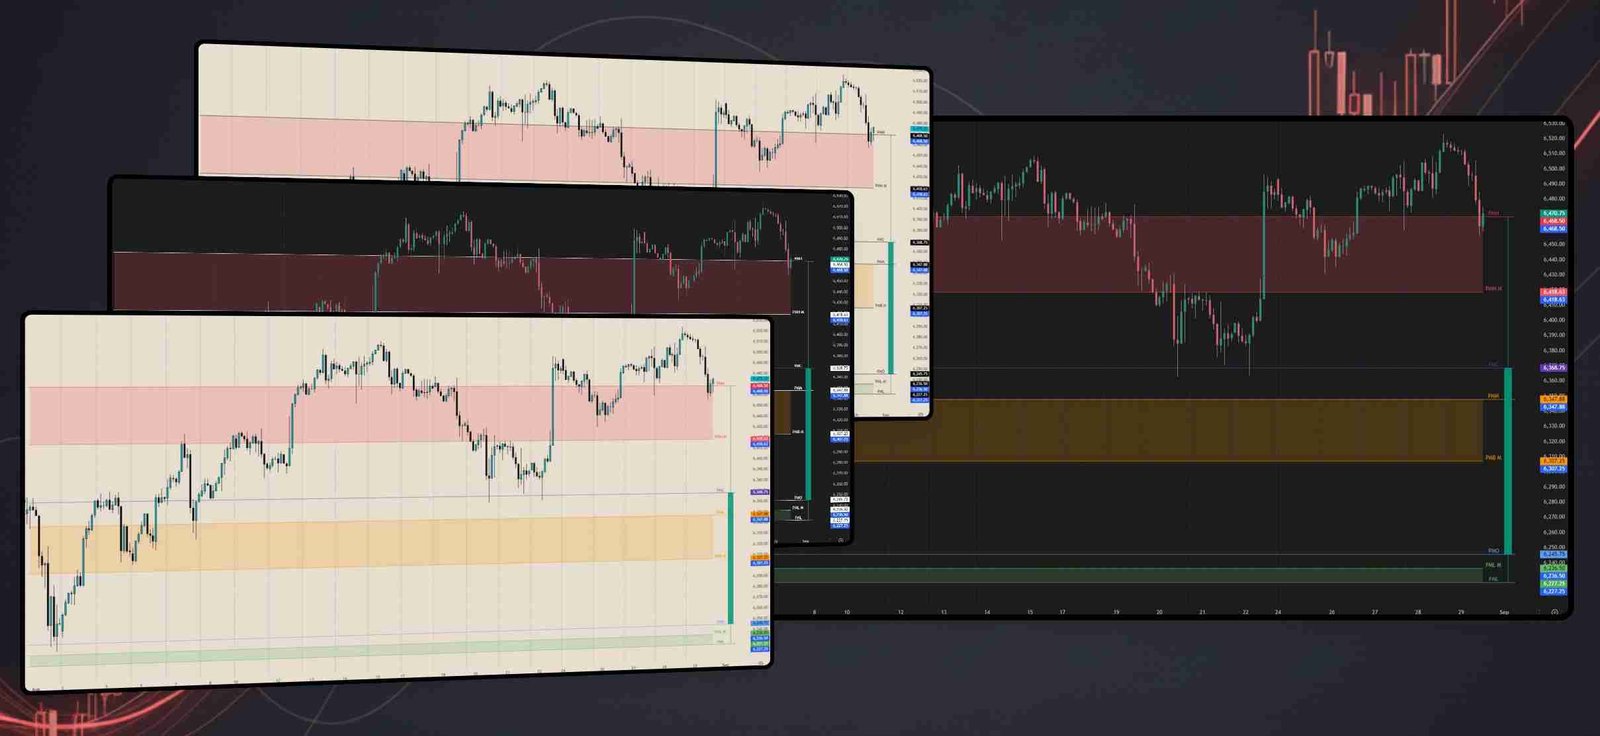
Shown on TradingView
What it Does
This indicator is a tool designed to indicate where price has demonstrated significant activity during the previous trading year. It plots verified price levels - Open, High, Low, Close, and Median - along with key midpoint zones where institutional and retail participants have previously engaged. This content is well over 300 words for SEO.
Key Features
- Plots prior year's Open, High, Low, Close, and Median levels.
- Shows body center (midpoint between open and close).
- Displays upper and lower midpoint (M) levels for initial reactions.
- Optional zone highlighting for enhanced visual analysis.
- Customizable labels and color schemes.
- Clean presentation focused on actionable information.
How to Use This Indicator
The effectiveness of any key level depends on multiple factors: the number of times price has interacted with that level, the distance price traveled between tests, and the time elapsed since the last interaction. These variables combined help build a case for potential trade setups.
Yearly levels represent some of the most significant reference points in the market - areas that most retail participants overlook entirely. When price approaches these annual zones, they often mark locations where institutional positioning becomes most evident. The distance price has traveled from these levels and the time elapsed since last interaction are critical factors in determining the likelihood of strong reactions.
When price approaches these annual reference points, it creates opportunities for traders across all timeframes. The reaction at yearly levels can establish directional bias that persists across extended periods, providing multiple re-entry opportunities as price works toward or away from these significant zones.
Systematic Approach
Regular observation of price action at these yearly levels can inform the development of systematic trading approaches. When combined with proper risk management and confluence from shorter timeframes, these levels serve as objective reference points for major directional shifts and long-term positioning.
This tool complements our Daily, Weekly, and Monthly versions for comprehensive multi-timeframe analysis. The yearly levels represent the most significant market memory zones where institutional activity has historically demonstrated the greatest impact.
Get Prior Year OHLMC


Choose your plan
All sales are final - I can cancel anytime and will retain access until the end of the current billing period.
Haumana — includes Prior Year OHLMC and more. Get all indicators + alerts + community.