
Stack the Map — Session Range Pro Meets Weekly Dealing Range
Day map and week map on the same chart. When Session Ranges Pro and Weekly Dealing Range agree, location is clear. When they disagree, you know which timeframe is lying.
Tools & Indicators · Session Ranges Pro + Weekly Dealing Range Pro
One map answers “where is the day?” Another answers “where is the week?” Most traders run one and freestyle the other. The desk runs both on the same chart.
Session Ranges Pro draws Asia, London, and New York boxes — highs, lows, medians, extensions, golden zones. Weekly Dealing Range Pro draws Monday’s H / M / L / O and the weekly extension ladder. When those two maps agree, you are not guessing. When they disagree, you know which timeframe is lying to you.
This is not a paste of the session post plus the weekly post. It is the same tape with both rulers visible.
What gets misread
Session traders fade a New York high and ignore that the same print is still below WDR M — they just sold discount on the week. Weekly traders buy a WDR L bounce and ignore that the session already spent a full extension into exhaustion — they just bought the spent day. Stacking the maps forces the question: is this a day trade inside a weekly location, or a weekly location that the day has already finished?
Both maps on one screen
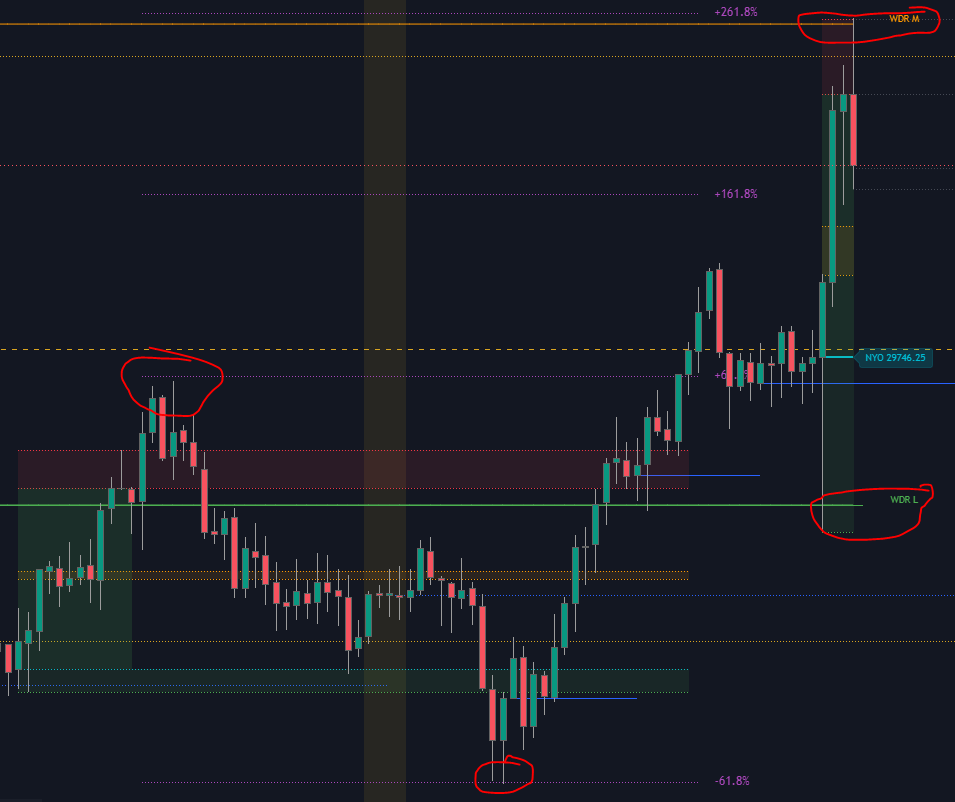
July 9, first drop: founder caption was short — the value of knowing SessionRangesPro and WeeklyDealingRangePro together. The chart shows session shading through the day, fib-style extensions (−61.8% through +261.8%), NY open labeled, and WDR L / WDR M circled where price used them. Price found the deep extension, then cleared WDR L on the expansion and ran toward WDR M where the +261.8% lined up. Day map for the path. Week map for the destination.
Minutes later, same morning, second
Related Articles

Session Ranges Are the Map — Asia Sets It, NY Trades It
Asia and London already drew the day's boxes. Session Ranges Pro keeps session highs, lows, medians, and extensions on the chart so New York is a decision against a map — not a fresh guess.

When There Is Nothing to the Left — Weekly Dealing Range Carries the Week
At ATH there is nothing useful to the left. Monday's range becomes the week's dealing map — WDR H/M/L and the extension ladder — for location, not a win reel.
How to Set Up TradingView & Connect Your PonoTrading Indicators
Link your exact TradingView username in the PonoTrading dashboard, grant invite-only access, then add the scripts on the same account you actually chart with.