PPI Shock Hits a Stretched Tape as Inflation Risk Moves Back to Center Screen - Market Pulse for Wednesday, May 13, 2026
Market Pulse for Wednesday, May 13, 2026: hot PPI, stretched ES/NQ/RTY quarterly expected-move alerts, elevated crude volatility, and futures trade-planning scenarios.
PPI Shock Hits a Stretched Tape as Inflation Risk Moves Back to Center Screen - Market Pulse for Wednesday, May 13, 2026
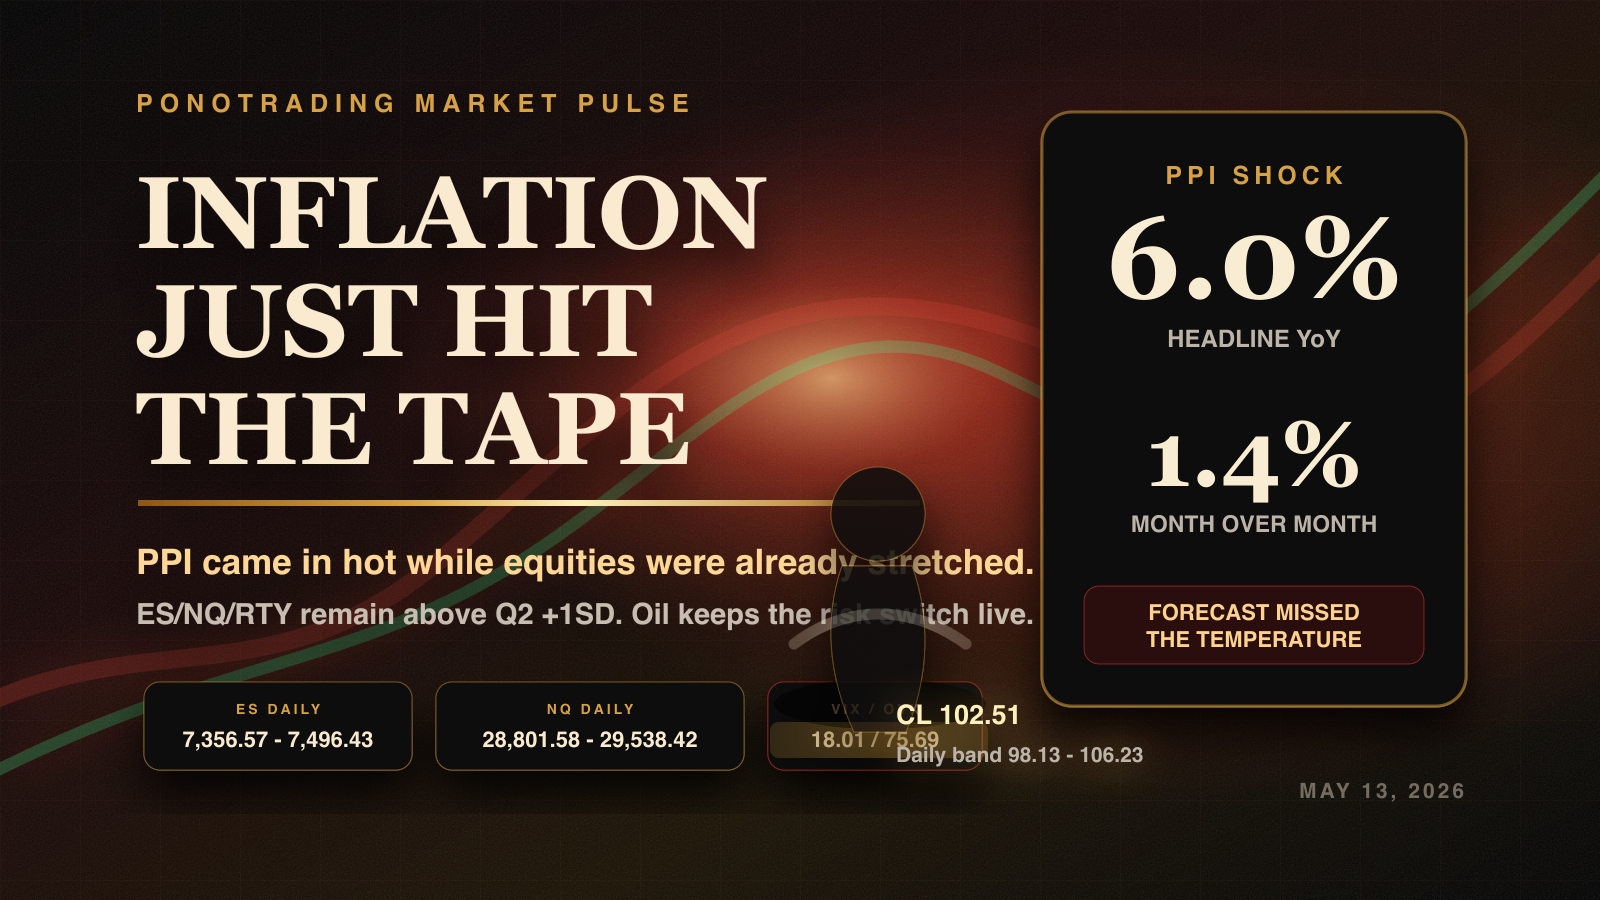
> April PPI did not whisper. Headline final demand printed near +1.4% month over month and +6.0% year over year, landing far hotter than the market was positioned to calmly absorb. The issue is not the number by itself. The issue is location: ES, NQ, and RTY are still above quarterly +1SD expected-move zones while crude volatility remains elevated.
---
What You Need To Know Right Now
The PPI print just changed the tone of the morning.
Headline producer prices rose about 1.4% month over month and 6.0% year over year for April. The common expectation was looking for a much cooler print, closer to a controlled inflation read. Instead, the market got a number that forces traders to respect the possibility that yesterday's CPI heat was not a one-off.
Core readings were also firm enough to matter. Final demand less food and energy rose about 0.7% month over month and 4.6% year over year. The cleaner final-demand measure that strips food, energy, and trade services rose about 0.6% month over month and 4.4% year over year.
That combination matters because equities were already stretched.
The PonoTrading expected-move run for Wednesday shows:
| Product | Current Reference | Daily 1SD Range | Planning Read |
|---|---|---|---|
| ES | 7,421.00 | 7,356.57 - 7,496.43 | Still above Q2 +1SD at 7,399.17; watch whether buyers defend that line after PPI. |
| NQ | 29,247.75 | 28,801.58 - 29,538.42 | Leadership remains stretched; monthly +1SD near 29,290.95 is still a major decision zone. |
| YM | 49,615 | 49,399 - 50,339 | Cleaner inside-range read; watch whether Dow weakness broadens the reaction. |
| RTY | 2,841.20 | 2,823.56 - 2,877.24 | Breadth remains above Q2 +1SD at 2,828.93 but has less room for sloppy risk. |
| GC | 4,685.80 | 4,611.10 - 4,744.10 | Gold becomes more important if rates/inflation stress spreads. |
| CL | 102.51 | 98.13 - 106.23 | Oil is still the inflation switch; above 104.95 keeps pressure alive. |
Volatility is not screaming panic, but it is not asleep: VIX 18.01, VXN 24.13, GVZ 27.16, and OVX 75.69.
The core read: this is not a clean risk-on morning. This is a reaction morning. Trend can survive, but the market has to prove it can absorb hotter wholesale inflation without rejecting the stretched zones.
Prior Session
The prior session left the tape in a complicated position.
Buyers were still defending the larger trend, but the market was already extended. ES, NQ, and RTY were trading above their quarterly +1SD expected-move maps. That tells us the market was not sitting in a cheap, washed-out location when PPI hit. It was sitting in a place where good news needs to keep being good, and bad news can punish late entries quickly.
That is why this print matters more than a normal macro headline.
When inflation surprises hot while the market is already extended, the first move can be noisy. The better read comes after the opening reaction: does price hold above the stretched map, or does it fail back inside and turn yesterday's buyers into supply?
Overnight Markets
Overnight trade kept risk elevated but not broken. Equity futures were holding near stretched levels, crude stayed firm, and volatility remained high enough to demand respect.
CL is currently near 102.51 with a daily 1SD range of 98.13 - 106.23 and a weekly upper 1SD level near 104.95. That weekly level matters because oil is no longer just an energy product on the side of the screen. It is part of the inflation story.
If crude accepts above the weekly upper band, PPI gets a stronger confirmation signal. If crude rejects and moves back toward the daily midpoint near 102.18, equities may get room to stabilize even with the hot print.
Gold is the second macro tell. GC is trading near 4,685.80 inside a daily 1SD range of 4,611.10 - 4,744.10. A move toward the upper daily band near 4,744.10 would suggest the market is hedging the inflation/rates impulse more aggressively.
US Futures
ES
ES remains the cleanest risk benchmark.
The daily 1SD range is 7,356.57 - 7,496.43, with the daily midpoint near 7,426.50. The quarterly +1SD level is 7,399.17.
Above that quarterly level, buyers can still argue that the market is absorbing inflation pressure. Below it, the PPI shock becomes more dangerous because ES would be failing back inside the higher-timeframe expected-move map. The first practical downside references are the daily midpoint and then the daily lower band near 7,356.57.
The bull case needs acceptance. The bear case needs failed acceptance.
NQ
NQ is still leadership, but it is leadership in a stretched location.
The daily 1SD range is 28,801.58 - 29,538.42, and the monthly +1SD level near 29,290.95 remains a major magnet. If NQ reclaims and holds above that area, AI/growth leadership can keep the tape supported.
If NQ loses the daily lower band near 28,801.58 and cannot reclaim, the market may start pricing hotter PPI through valuation pressure. That does not require a crash. It only requires enough failed continuation to make late longs uncomfortable.
RTY
RTY is the breadth check.
The daily 1SD range is 2,823.56 - 2,877.24, and the quarterly +1SD line sits near 2,828.93. Holding above that zone keeps the market broader than mega-cap tech. Losing it would tell us hotter inflation is starting to pressure the riskier side of the equity complex.
RTY does not need to lead today, but it cannot quietly break while ES and NQ pretend everything is fine.
CL
CL is the inflation confirmation product.
The daily 1SD range is 98.13 - 106.23, with the weekly upper 1SD near 104.95. If oil accepts above that weekly band after a hot PPI print, the market has a harder time dismissing inflation risk. If oil rejects and falls back toward the daily midpoint near 102.18, the equity tape may be able to absorb the print.
For traders, that means CL is not optional today. It is part of the read.
Expected Move Map
The daily map gives us the battlefield:
| Product | Daily Midpoint | Daily 1SD | Daily 2SD |
|---|---|---|---|
| ES | 7,426.50 | 7,356.57 - 7,496.43 | 7,286.64 - 7,566.36 |
| NQ | 29,170.00 | 28,801.58 - 29,538.42 | 28,433.15 - 29,906.85 |
| RTY | 2,850.40 | 2,823.56 - 2,877.24 | 2,796.72 - 2,904.08 |
| GC | 4,677.60 | 4,611.10 - 4,744.10 | 4,544.60 - 4,810.60 |
| CL | 102.18 | 98.13 - 106.23 | 94.08 - 110.28 |
The higher-timeframe alerts remain the real context:
That does not mean short everything. It means the market is already extended, so confirmation matters more. A hot PPI print hitting a balanced tape is one thing. A hot PPI print hitting a stretched tape is different.
Market-Moving Headlines
The headline is PPI.
April producer inflation came in hot enough to challenge the idea that inflation pressure is quietly fading. Headline final demand near +1.4% MoM and +6.0% YoY is not a subtle number. It puts rates, inflation expectations, margins, and valuation sensitivity back into the conversation.
The second headline is oil. Crude remains elevated and OVX is still near 75.69. If oil strengthens while PPI is hot, the inflation story gets confirmation. If oil fades, the market may treat PPI as a shock that needs digestion rather than a full regime shift.
The third headline is positioning. ES, NQ, and RTY are still above Q2 +1SD levels. That is the part many traders miss. The question is not whether PPI is bullish or bearish in a vacuum. The question is whether the tape can keep accepting higher prices after a hot wholesale inflation print.
Economic Calendar Watch
| Event | Why It Matters |
|---|---|
| PPI reaction | The first move is noise; the hold or failure after the first move is the signal. |
| Crude oil response | Oil either confirms inflation pressure or gives equities relief. |
| Treasury/rate response | Hot PPI matters more if rates reprice aggressively. |
| Claims / retail data ahead | The next labor/consumer reads will determine whether this becomes a one-day shock or a broader macro reset. |
Earnings And Leadership Context
AI and large-cap growth leadership still matter. NQ has stretched as far as it has because the market continues to reward the strongest growth themes. But hot inflation changes the quality bar.
If leaders hold bid while ES stays above quarterly +1SD and crude rejects higher, the bullish structure survives. If leadership narrows, rates firm, and RTY starts losing its daily lower band, the market becomes more fragile.
Leadership can save the tape. It just has to prove it.
The Plan
Today's plan is not to guess whether inflation is bullish or bearish. The plan is to let the tape answer three questions:
If those answers are constructive, buyers still have a case. If those answers deteriorate together, traders should respect downside rotation risk.
Trade Planning Scenarios
Bullish Continuation
The bullish case is that the market absorbs PPI. ES holds above 7,399.17, NQ reclaims or holds around 29,290.95, RTY defends 2,828.93, and crude fails to build above its weekly upper band.
If that happens, dips can still be bought, but only with structure. The cleanest longs come from pullback-hold, reclaim, or acceptance above a decision zone. Chasing the first hot-data candle is not the edge.
Controlled Pullback
The controlled pullback case is ES slipping back toward the daily midpoint near 7,426.50 without volatility exploding. That would be digestion, not collapse.
In that version, traders should look for whether buyers defend the midpoint and whether NQ leadership remains intact. A controlled pullback after a hot PPI print can reset poor location and create cleaner continuation later.
Failed Acceptance
The risk case is failed acceptance above the stretched map.
If ES loses 7,399.17, NQ loses the daily lower band, RTY fails back below Q2 +1SD, and crude accepts above the weekly upper band, the market has the ingredients for a sharper rotation. Not because PPI predicts direction. Because hot inflation would be hitting a market that could not hold elevated prices.
Actionable Levels
| Trigger | What It Means | First Area To Watch |
|---|---|---|
| ES holds Q2 +1SD | Trend absorbs the PPI shock | 7,496.43 |
| ES loses Q2 +1SD | Stretched acceptance fails | 7,426.50 |
| NQ reclaims monthly +1SD | Growth leadership remains intact | 29,538.42 |
| RTY loses daily lower band | Breadth starts breaking | 2,828.93 |
| CL accepts above weekly +1SD | Inflation confirmation strengthens | 110.28 |
Trader Mindset
Today is not a day to be right about inflation. It is a day to be disciplined around reaction.
Hot PPI creates emotion. Stretched equities create poor location. Elevated crude volatility creates headline sensitivity. Those ingredients can produce clean opportunity, but only if the trader waits for structure.
The mistake is deciding that hot PPI must mean one direction. The edge is watching what price does at the levels everyone else is too emotional to respect.
Define the level. Wait for acceptance or rejection. Trade the structure, not the headline.
Bottom Line
Wednesday's Market Pulse is a stress test.
PPI came in hot, wholesale inflation pressure is back on the screen, and the market has to absorb that shock while ES, NQ, and RTY remain above quarterly +1SD expected-move levels. That is not a normal location. That is a market that needs clean proof before traders press risk.
If buyers defend the stretched zones and crude backs away, the trend can survive. If equities fail back inside the map while crude accepts higher, the pullback can move faster than traders expect.
Want the daily prep room, expected-move levels, and trader accountability before the bell? Join the free PonoTrading prep room.
PonoTrading Team
PonoTrading publishes futures trading education, market structure notes, expected move analysis, and practical indicator workflows for retail traders.
Related Articles

Quarter-End Rotation Tests Nasdaq Repair as Oil Relief Keeps ES Steady - Market Pulse for Tuesday, June 30, 2026
Market Pulse for Tuesday, June 30, 2026: quarter-end flows, softer crude, and a broad-market bid are giving bulls room, but Nasdaq leadership still has to prove real acceptance.

Oil Relief Gives Bulls a Chance, but Fresh Weekly Levels Still Need Acceptance - Market Pulse for Monday, June 29, 2026
Market Pulse for Monday, June 29, 2026: oil relief and a U.S.-Iran pause give bulls a cleaner opening, but fresh weekly expected-move levels and June tech damage still need real acceptance.

Tech Pressure Returns as PCE Stays Hot and Oil Cools - Market Pulse for Friday, June 26, 2026
Tech pressure returns into Friday as Nasdaq and semiconductors carry the risk-off tone, oil cools, PCE stays hot, and the daily expected-move map defines whether buyers can repair the tape.