Jobs Beat Meets Record-High Pressure as NQ Stretches the Weekly Map - Market Pulse for Friday, May 8, 2026
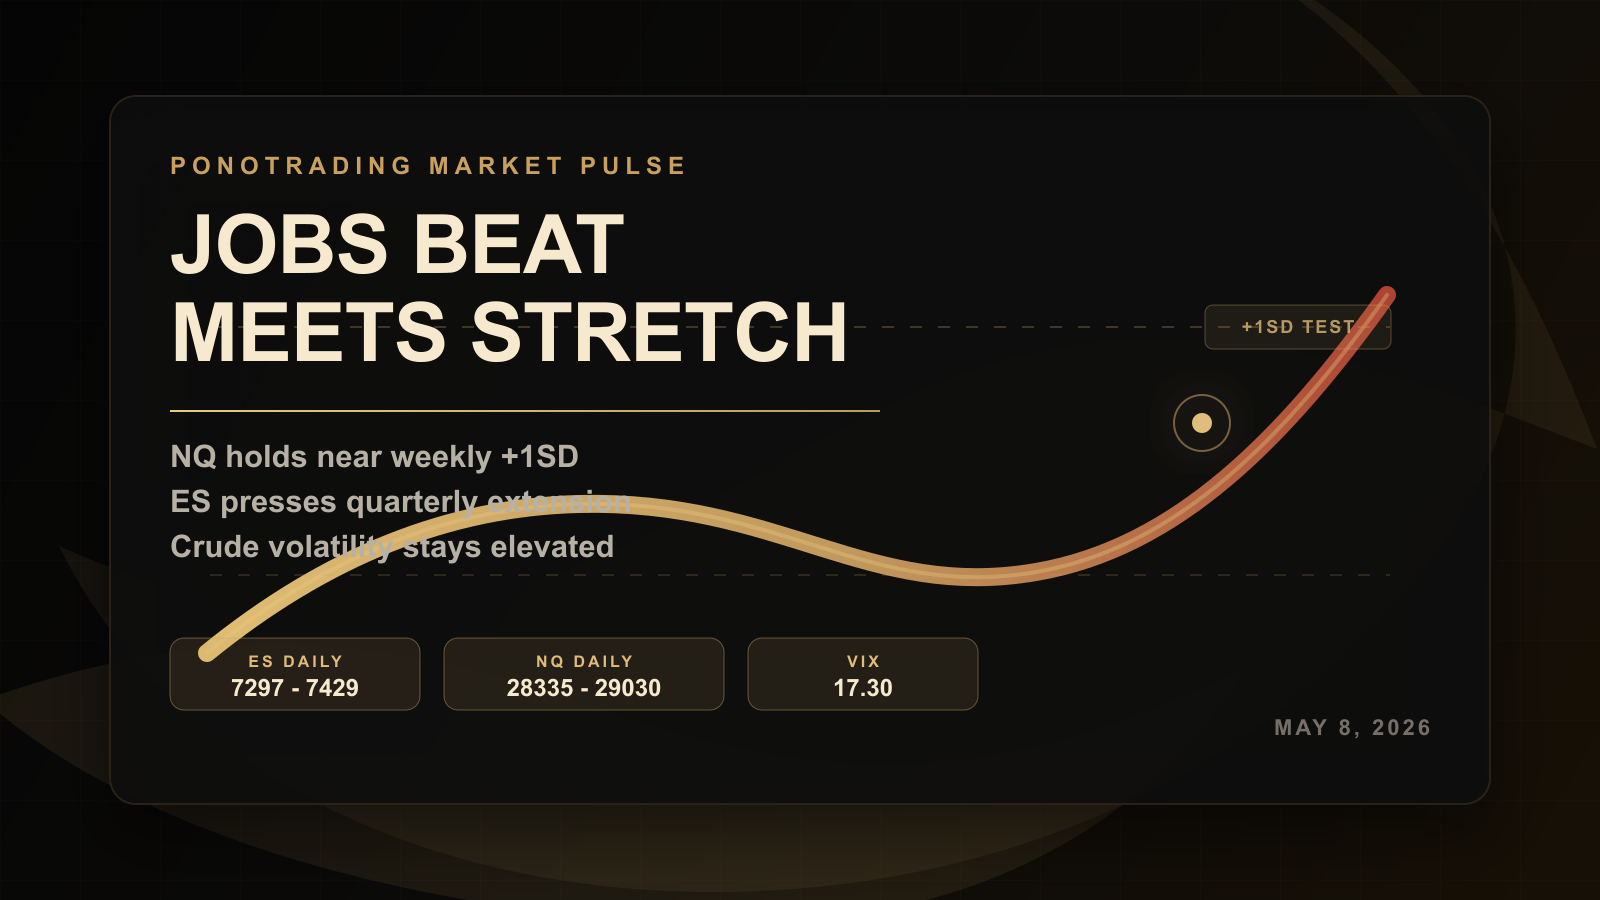
Market Pulse for Friday, May 8, 2026: a stronger-than-feared jobs report keeps risk bid, but ES, NQ, and RTY remain stretched against higher-timeframe expected-move zones while crude volatility stays elevated.
Jobs Beat Meets Record-High Pressure as NQ Stretches the Weekly Map - Market Pulse for Friday, May 8, 2026
> A better-than-feared jobs report gave buyers permission to press, but the tape is not early anymore. NQ is sitting right on top of its weekly +1SD zone, ES is still stretched on the quarterly map, and crude volatility remains the macro switch that can change the day quickly.
---
What You Need To Know Right Now
Friday's tape is trying to close the week with risk still in control. The main reason is simple: April payrolls came in stronger than the market feared, while wage pressure stayed contained enough that traders did not have to immediately reprice the Fed path in a hostile way.
The clean read: the labor market cooled, but did not break.
That is the kind of report that can keep buyers engaged near highs. It gives equity bulls enough growth support to defend the trend, while the softer wage component helps keep the inflation narrative from getting too hot. The problem is not the headline. The problem is location.
As of the PonoTrading Expected Moves run, ES was mapped from the prior close near 7,363, NQ near 28,682.25, YM near 49,700, RTY near 2,848.90, gold near 4,699.80, and crude near 94.81. VIX was 17.30, VXN 24.12, GVZ 26.76, and OVX 71.85.
That puts today's daily 1SD map at:
| Product | Daily 1SD | Current Reference | Read |
|---|---|---|---|
| ES | 7,297.17 - 7,428.83 | 7,363 | Testing quarterly +1SD acceptance. |
| NQ | 28,334.70 - 29,029.80 | 28,682.25 | Sitting on weekly +1SD and above quarterly stretch. |
| YM | 49,256 - 50,144 | 49,700 | Holding inside the daily map. |
| RTY | 2,823.43 - 2,874.37 | 2,848.90 | Above quarterly +1SD with breadth implications. |
| GC | 4,633.31 - 4,766.29 | 4,699.80 | Balanced inside the daily volatility band. |
| CL | 91.22 - 98.40 | 94.81 | Still the macro pressure valve. |
The higher-timeframe alerts are the more important part:
That is not bearish by itself. It means the market is operating from an extended part of the distribution. When the indexes are above higher-timeframe +1SD zones, the best trades usually come from acceptance, pullback-reclaim, or clean failed-breakout structure. Chasing into the first emotional candle becomes lower quality.
Prior Session
Thursday was the warning shot after Wednesday's record push. The broader rally did not collapse, but the tape showed fatigue after S&P 500 and Nasdaq had already pressed into record territory earlier in the week.
The important tell was that the market did not fully reject the bullish story. It paused. Oil recovered from the prior breakdown area, geopolitics stayed sensitive, and traders had to wait for Friday's labor data before deciding whether the next move was continuation or digestion.
That makes today's session a continuation test rather than a fresh breakout from a clean base. Buyers have momentum, but not much room for sloppy entries if the market starts rejecting above the upper side of the daily expected move.
Overnight Markets
The overnight message was constructive but stretched. Index futures stayed firm enough to keep the risk-on story alive, while crude held in the mid-90s after the violent oil swings earlier in the week.
That matters because crude is still the macro hinge. Equity traders want to treat the oil spike as a fading risk, but OVX near the low 70s says energy volatility is still elevated. If crude stays contained, the market can keep focusing on earnings, AI leadership, and resilient growth. If crude squeezes back toward the upper daily range, the inflation and headline-risk conversation can return quickly.
Gold is not screaming panic here. The GC daily 1SD range from 4,633.31 to 4,766.29 keeps it inside a normal volatility map, and the broader gold structure remains less important today than the equity/oil relationship.
US Futures
The ES map is clean: 7,297.17 - 7,428.83 is the daily 1SD range. Above 7,428.83, ES is pressing beyond the normal daily volatility band. Below 7,297.17, the market is no longer simply digesting; it is giving back the jobs-report bid.
The bigger issue is the quarterly alert. ES remains above its Q2 +1SD boundary near 7,399.17. That makes the 7,399 - 7,429 zone especially important. Acceptance above that area can keep the breakout alive. A failed hold above it can turn the session into a mean-reversion day back toward the middle of the daily map.
NQ is the leadership product, but it is also the most stretched. The daily NQ 1SD range is 28,334.70 - 29,029.80, and the weekly +1SD level is almost exactly where price is operating: 28,680.73. That is a major decision area.
If NQ holds above the weekly +1SD and builds acceptance, buyers can keep pressing toward the daily upper band. If it loses that zone and cannot reclaim, the market may shift from trend continuation into pullback/retest behavior.
RTY is still above its Q2 +1SD boundary near 2,828.93. Small caps staying firm helps the breadth story. But if RTY loses 2,823 - 2,829, that would be an early sign that the risk-on move is becoming narrower again.
Expected Move Context
The expected-move map says this is not a low-stakes location.
ES daily midpoint: roughly 7,363 NQ daily midpoint: roughly 28,682 RTY daily midpoint: roughly 2,849 CL daily midpoint: roughly 94.81For ES, the clean bull case is holding above the quarterly +1SD zone and treating 7,399 as acceptance rather than exhaustion. For NQ, the clean bull case is holding the weekly +1SD zone near 28,681 and converting it into support.
The danger is a high-open / fail-to-hold profile. When a market opens strong after a data beat, traders often assume the headline is enough. But if price cannot hold above the prior acceptance area, late longs become fuel for a rotation lower.
Today's best read is not "bullish or bearish." It is:
Headlines
The headline stack is doing two things at once.
First, jobs came in stronger than feared. Payroll growth was enough to support the growth narrative, while unemployment held steady and wage growth did not create an immediate inflation scare. That is why the market was able to lean risk-on instead of treating the report as a Fed problem.
Second, consumer confidence remains fragile. Preliminary May sentiment is still weak, and inflation expectations remain an issue for the broader macro backdrop. That keeps the Fed conversation complicated. Stronger labor plus weak sentiment is not a simple story. It says households are still feeling pressure even while employment data avoids a hard-break signal.
Third, the oil/geopolitical story is still alive. The equity market has been willing to look through the worst-case oil scenario, but crude near the mid-90s and OVX above 70 mean traders should keep energy on the screen all day.
Economic Calendar
The major data items for Friday are already the main event:
| Event | Market Read | Why It Matters |
|---|---|---|
| Nonfarm payrolls | Stronger than feared | Supports the growth side of the risk-on argument. |
| Unemployment rate | Steady near 4.3% | Keeps the labor cooling story from becoming a break signal. |
| Average hourly earnings | Softer wage pressure | Helps avoid an immediate inflation scare. |
| University of Michigan sentiment | Weak consumer mood | Keeps the macro backdrop complicated despite firm employment. |
| Wholesale inventories | Secondary | Feeds GDP/inventory tracking more than intraday emotion. |
The market reaction matters more than the release itself now. If buyers keep ES/NQ above the key expected-move zones, the data gets treated as confirmation. If price rejects those zones, the same data can become "priced in" by lunch.
Earnings
The earnings backdrop still favors the bull case, especially through AI and large-cap technology leadership. The market has been rewarding companies tied to AI capex, semiconductors, cloud, and infrastructure spending. That leadership is a major reason NQ has been able to keep stretching beyond higher-timeframe expected-move boundaries.
But stretched leadership comes with a trade management problem. When NQ is above weekly and quarterly +1SD, good news can still push price higher, but the best setups require structure. Late buyers need either a pullback into support, a reclaim after a flush, or a clean acceptance build above the level.
If the AI leaders hold bid and breadth remains decent, dips can stay shallow. If leadership narrows and RTY loses its quarterly stretch zone, the tape becomes more selective.
The Plan
ES
The key ES zone is 7,399 - 7,429. That combines the Q2 +1SD alert area with the upper side of today's daily 1SD map.
Above that zone with acceptance, the market can keep pressing. Below it, watch for a rotation back toward 7,363, the prior-close midpoint of the daily map. A deeper loss of 7,297 would change the session tone and put sellers in control.
NQ
NQ is all about 28,681 - 29,030. The lower part is the weekly +1SD decision zone. The upper part is the daily +1SD boundary.
If NQ holds above 28,681, leadership remains intact. If it fails that level and cannot reclaim, the better trade may be patience for a pullback toward the daily midpoint or lower range. Above 29,030, longs need acceptance; otherwise, watch for a failed extension.
RTY
RTY must defend 2,823 - 2,829 to keep the small-cap stretch alive. If it holds, breadth remains constructive. If it loses, the rally can become more mega-cap dependent.
CL
Crude's daily map is 91.22 - 98.40. Inside that range, equities can probably keep treating oil as contained. Above 98.40, headline and inflation sensitivity can rise again. Below 91.22, oil pressure cools and risk assets may get more breathing room.
Trade Ideas
These are planning scenarios, not trade recommendations.
Scenario 1: NQ acceptance long. If NQ holds above the weekly +1SD zone near 28,681, pulls back, and reclaims with clean internals, the long side can target the upper daily band near 29,030. The invalidation is a failed reclaim back below the weekly +1SD area. Scenario 2: ES failed-extension short. If ES pushes above the 7,399 - 7,429 zone but cannot hold, a failed breakout can target the daily midpoint near 7,363. This needs rejection, not guessing. Scenario 3: RTY breadth check. If RTY loses 2,823 - 2,829, be careful assuming the rally is broad. That would favor selectivity and reduce confidence in chasing index highs. Scenario 4: Crude headline hedge. If CL reclaims above 98.40, oil is back outside the daily expected move. That can pressure risk appetite and make equity longs more vulnerable to sudden de-risking.Mindset
Friday is a discipline day.
The market gave bulls enough data to keep pressing, but the map is not handing out cheap entries. The mistake is assuming a bullish headline means every long is high quality. It does not. Location still matters.
When price is above higher-timeframe +1SD, the trader's job is to separate acceptance from emotion. Acceptance builds. Emotion spikes. Acceptance holds pullbacks. Emotion fails and traps late buyers.
Do not trade the headline. Trade the level after the headline.
Bottom Line
The jobs report helped the bulls, but the expected-move map says this rally is stretched. ES is working around quarterly +1SD, NQ is sitting on weekly and quarterly stretch, and RTY is still above its quarterly band.
That keeps the trend constructive, but it raises the bar for entries. The best long trades need acceptance. The best short trades need failed extensions. The worst trades are late reactions after the move already happened.
Want the daily prep room, expected-move levels, and trader accountability prompts before the bell? Join the free PonoTrading prep room.
PonoTrading Team
PonoTrading publishes futures trading education, market structure notes, expected move analysis, and practical indicator workflows for retail traders.
Related Articles

Quarter-End Rotation Tests Nasdaq Repair as Oil Relief Keeps ES Steady - Market Pulse for Tuesday, June 30, 2026
Market Pulse for Tuesday, June 30, 2026: quarter-end flows, softer crude, and a broad-market bid are giving bulls room, but Nasdaq leadership still has to prove real acceptance.

Oil Relief Gives Bulls a Chance, but Fresh Weekly Levels Still Need Acceptance - Market Pulse for Monday, June 29, 2026
Market Pulse for Monday, June 29, 2026: oil relief and a U.S.-Iran pause give bulls a cleaner opening, but fresh weekly expected-move levels and June tech damage still need real acceptance.

Tech Pressure Returns as PCE Stays Hot and Oil Cools - Market Pulse for Friday, June 26, 2026
Tech pressure returns into Friday as Nasdaq and semiconductors carry the risk-off tone, oil cools, PCE stays hot, and the daily expected-move map defines whether buyers can repair the tape.