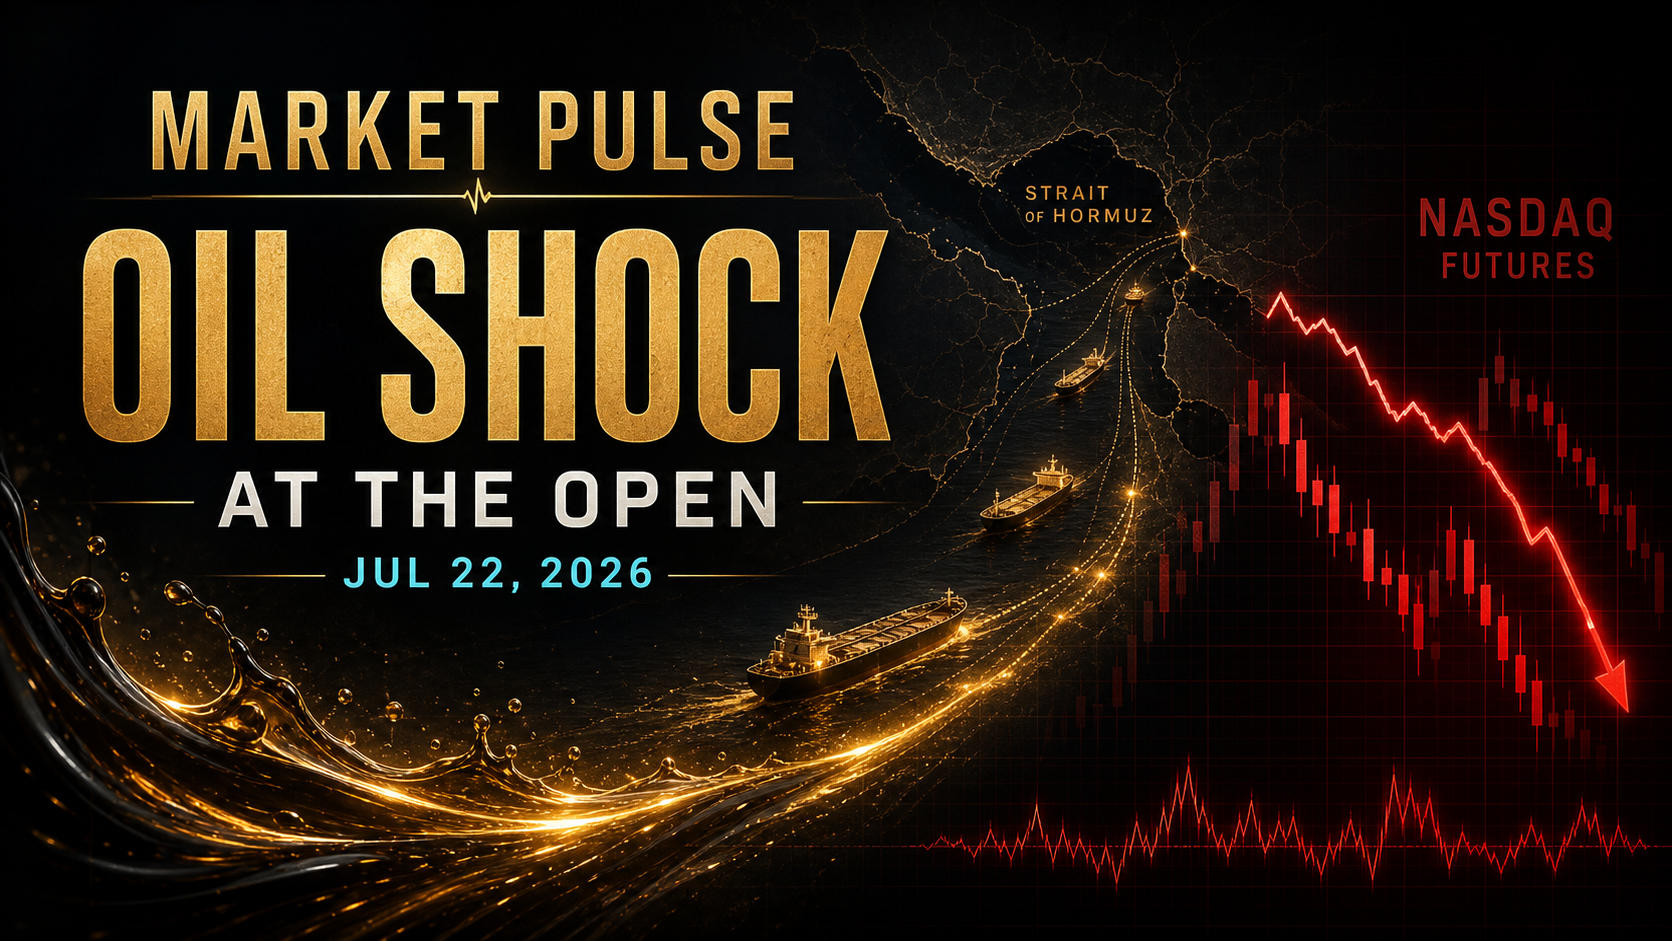
Market Pulse: Oil Shock and Iran Escalation Put the Open on Defense
Renewed U.S.-Iran fighting and disrupted Strait of Hormuz shipping have sent crude sharply higher, pressured Nasdaq futures, and made SPX 7,477.30 plus the daily expected-move boundaries the key opening decision points.
Wednesday, July 22, 2026
What You Need To Know
U.S. equity futures are entering Wednesday's cash session with a defensive bias as renewed U.S.-Iran fighting pushes crude oil sharply higher and adds fresh risk around the Strait of Hormuz. Nasdaq futures are carrying the heaviest pressure, gold remains firmly bid, and Treasury yields are elevated enough to keep long-duration growth stocks sensitive to every move in energy.
This is no longer a generic “oil is firm” setup. The Associated Press reported that Wall Street futures fell while oil jumped about 4% as the United States and Iran exchanged fire, shipping through the Strait of Hormuz remained severely disrupted, and Houthi threats introduced another risk to Red Sea energy traffic. Before the bell, AP showed S&P 500 futures down roughly 0.4%, Dow futures down 0.2%, and Nasdaq futures down 0.9%.
The opening question is whether the oil shock produces sustained equity liquidation or an early risk-off gap that stabilizes inside the statistical range. The answer should come from three relationships: NQ versus ES, crude versus its upper daily band, and SPX versus the dealer-gamma pivot discussed below.
Prior Session
Tuesday delivered a broad equity repair. The S&P 500 gained 0.89%, the Nasdaq Composite rose 1.29%, the Dow added 0.74%, and the Russell 2000 advanced 1.54%. NQ and RTY futures both finished above their daily +1SD boundaries, while ES closed near the top of its daily field.
That matters because Wednesday is not beginning after a weak close. It is beginning after buyers proved acceptance—then received a fresh geopolitical and energy shock overnight. The market now has to decide how much of Tuesday's repair can survive a materially worse crude-oil backdrop.
| Market | Tuesday reference | Early Wednesday reference | Read |
|---|---|---|---|
| ES futures | 7,545.75 prior futures close | 7,517.50 | Pulling back from Tuesday's repair, but still inside the daily range |
| NQ futures | 29,316.00 | 29,048.00 | Largest index-futures decline and the clearest risk-off leadership signal |
| YM futures | 52,443 | 52,349 | Softer, but holding better than Nasdaq |
| RTY futures | 2,997.00 | 2,985.00 | Giving back part of Tuesday's breadth expansion |
| Gold futures | 4,071.10 | 4,136.80 | Strong hedge demand remains active |
| WTI crude futures | 84.91 | 86.82 | Primary cross-asset catalyst and headline-sensitive leader |
Overnight Markets
Asia finished mixed and Europe traded firmer, but the regional index picture understates the pressure in global energy markets. The Strait of Hormuz normally carries roughly one-fifth of internationally traded oil and gas, so every shipping headline has direct implications for inflation expectations, transport costs, and the bond market.
That creates an unusual handoff: European equities can remain positive while U.S. growth futures weaken because the U.S. index mix is more sensitive to mega-cap technology duration. If crude keeps extending and yields rise with it, NQ can remain the downside leader even without broad liquidation in Europe or small caps.
The stabilizing scenario is equally clear. If oil stops pressing higher, yields hold steady, and NQ begins reclaiming the overnight breakdown, Tuesday's strong close gives buyers a nearby foundation. The market does not need the geopolitical problem to disappear; it needs the cross-asset pressure to stop accelerating.
US Futures
The early futures board showed ES near 7,517.50, NQ near 29,048, YM near 52,349, and RTY near 2,985. Crude traded around 86.82 and gold near 4,136.80.
| Product | Early reference | Volatility input | Daily 1SD planning range | Daily 2SD planning range |
|---|---|---|---|---|
| ES | 7,517.50 | VIX 17.70 | 7,433.68 – 7,601.32 | 7,349.86 – 7,685.14 |
| NQ | 29,048.00 | VXN 26.66 | 28,560.16 – 29,535.84 | 28,072.32 – 30,023.68 |
| YM | 52,349.00 | VIX 17.70 proxy | 51,765.31 – 52,932.69 | 51,181.62 – 53,516.38 |
| RTY | 2,985.00 | VIX 17.70 proxy | 2,951.72 – 3,018.28 | 2,918.43 – 3,051.57 |
| GC | 4,136.80 | GVZ 23.94 | 4,074.41 – 4,199.19 | 4,012.03 – 4,261.57 |
| CL | 86.82 | OVX 63.78 | 83.33 – 90.31 | 79.84 – 93.80 |
These are volatility-derived planning ranges, not live option-straddle prices and not guaranteed support or resistance. The daily calculation uses the reference price multiplied by annualized volatility divided by the square root of 252. VIX is a broad-market proxy for YM and RTY, so those two ranges should be treated as contextual rather than contract-specific option-implied estimates.
The key distinction is location. ES and NQ are still inside their daily fields, while crude is already operating with a much wider volatility envelope. A red open inside 1SD is not automatically a breakdown. Acceptance beyond the lower boundary, especially with crude still advancing, is the cleaner expansion signal.
Market-Moving Headlines
The geopolitical escalation is the dominant macro input. AP reported an eleventh night of U.S. strikes against Iran, additional Iranian attacks on shipping, and Houthi threats involving Saudi tanker traffic in the Red Sea. That combination raises the risk that energy disruption reaches beyond one chokepoint.
The oil reaction matters through several channels at once:
- Higher crude can lift near-term inflation expectations and Treasury yields.
- Rising yields tighten the valuation test for Nasdaq and other long-duration assets.
- Airlines, transports, consumer cyclicals, and energy-intensive industries face a different margin equation.
- Energy and defense shares can outperform even while the major indexes weaken.
Single-stock dispersion is also elevated. AP reported Super Micro Computer sharply higher in premarket trading after an upbeat earnings preview, a reminder that company-specific AI demand can remain powerful even when the broad Nasdaq tape is under pressure.
Rates and Dollar
The early cross-asset snapshot placed the 10-year Treasury yield near 4.64%, the 5-year near 4.39%, and the dollar index close to 101.11.
The important signal is not simply whether yields are “high.” It is whether they rise with crude. A simultaneous advance in oil, yields, and the dollar would tighten financial conditions and increase the chance that an NQ-led decline broadens. If oil remains elevated but yields fade, the bond market would be signaling more concern about growth than a durable inflation shock, which can create a different sector rotation.
For index traders, watch the 10-year alongside the first NQ bounce. A weak NQ reclaim with yields making new morning highs is lower quality than the same price pattern with yields retreating.
Economic Calendar
The main scheduled U.S. event is the EIA Weekly Petroleum Status Report at 10:30 a.m. ET. Because crude is already reacting to geopolitical supply risk, the inventory release can amplify rather than replace the headline-driven move.
| Time (ET) | Event | Why it matters |
|---|---|---|
| 9:30 a.m. | U.S. cash open | Tests whether the overnight defensive gap develops acceptance or begins repairing |
| 10:30 a.m. | EIA crude-oil inventories | Can accelerate or reverse the oil move and transmit into yields and equity risk appetite |
| Throughout session | Iran, Hormuz, and Red Sea headlines | The highest-impact unscheduled catalyst on the board |
| 4:00 p.m. onward | Major earnings window | Adds event risk after the index-futures session |
The calendar is otherwise light enough that price action and unscheduled geopolitical news can dominate. Traders should not assume the 10:30 release will be the day's only oil catalyst.
Fed Watch
The next major Federal Reserve event is the July 28–29 FOMC meeting, with the decision and press conference scheduled for July 29. There is no major scheduled Fed speech on today's Board calendar.
That leaves markets trading the policy implications rather than a same-day speaker. A sustained energy shock makes the inflation side of the Fed's mandate harder, while a broader risk-off move can tighten financial conditions without any change in the policy rate. The bond market's response will show which interpretation is winning intraday.
Earnings and Single-Stock Notes
Tesla is scheduled to release second-quarter 2026 results after the close, with its webcast at 5:30 p.m. ET, according to Tesla Investor Relations. IBM Investor Relations also lists its second-quarter earnings event for today at 5:00 p.m. ET.
For NQ, Tesla's result creates an additional reason to distinguish daytime index weakness from company-specific after-hours event risk. For the Dow, IBM can influence the after-close technology and enterprise-spending read. During the cash session, Super Micro's premarket surge is a useful breadth check for whether positive AI infrastructure news can stay insulated from the macro selloff.
Daily Expected Moves
The ETF map uses the same volatility-derived methodology. These anchors were checked shortly after 9:00 a.m. ET and are intended as a static planning map for today's session.
| Product | Reference | Volatility input | Daily 1SD range | Daily 2SD range |
|---|---|---|---|---|
| SPY | 748.28 | VIX 17.70 | 739.94 – 756.62 | 731.59 – 764.97 |
| QQQ | 708.97 | VXN 26.66 | 697.06 – 720.88 | 685.16 – 732.78 |
| IWM | 296.54 | VIX 17.70 proxy | 293.23 – 299.85 | 289.93 – 303.15 |
| DIA | 521.51 | VIX 17.70 proxy | 515.70 – 527.32 | 509.88 – 533.14 |
| GLD | 374.81 | GVZ 23.94 | 369.16 – 380.46 | 363.51 – 386.11 |
| USO | 128.85 | OVX 63.78 | 123.67 – 134.03 | 118.50 – 139.20 |
The best information comes from the reaction near the boundaries. A brief print outside 1SD is not enough. Acceptance, repeated defense, and cross-asset confirmation matter more than a single touch.
Weekly Expected Moves
The weekly map uses the reference price multiplied by annualized volatility divided by the square root of 52. It provides higher-timeframe context; it does not predict that the full range must trade.
| Product | Reference | Weekly 1SD range | Weekly 2SD range |
|---|---|---|---|
| SPY | 748.28 | 729.62 – 766.94 | 710.97 – 785.59 |
| QQQ | 708.97 | 682.35 – 735.59 | 655.72 – 762.22 |
| IWM | 296.54 | 289.15 – 303.93 | 281.75 – 311.33 |
| DIA | 521.51 | 508.51 – 534.51 | 495.51 – 547.51 |
| GLD | 374.81 | 362.17 – 387.45 | 349.53 – 400.09 |
| USO | 128.85 | 117.27 – 140.43 | 105.70 – 152.00 |
Midweek, the weekly ranges help prevent overreaction to a single opening move. QQQ can remain under pressure and still be inside its weekly field. The more important transition occurs when price begins accepting outside a weekly boundary while the volatility regime expands with it.
Gamma Flip Levels
Modigin's SPX gamma dashboard provides a delayed, model-derived dealer-gamma reference. Its latest displayed snapshot placed SPX spot at 7,509.20 and the SPX gamma flip near 7,477.30.
That level is useful as a regime reference, not as a universal truth. Gamma estimates vary by data source, option universe, open-interest assumptions, and calculation method. A delayed public model cannot replace live member-room order-flow or options data.
| Reference | Level | Practical use |
|---|---|---|
| SPX model gamma flip | 7,477.30 | Above the model pivot, dealer hedging may be more stabilizing; sustained trade below it can increase directional sensitivity |
| SPX prior cash reference | 7,509.20 | Roughly 32 points above the model flip; watch whether the opening gap holds above or crosses the pivot |
| ES daily 1SD field | 7,433.68 – 7,601.32 | Defines the broader volatility-based decision zone around the futures open |
| NQ daily 1SD field | 28,560.16 – 29,535.84 | Wider tech range means failed moves can reverse sharply and accepted breaks can extend quickly |
The strongest signal would be agreement across frameworks: SPX loses the gamma pivot, ES moves toward or through daily -1SD, NQ remains the downside leader, and oil continues higher. A quick SPX reclaim above the pivot while crude and yields retreat would favor repair instead.
The Plan
Defensive Continuation
- NQ cannot reclaim the opening range and remains weaker than ES.
- SPX accepts below the 7,477.30 model gamma flip.
- ES begins building value below its early midpoint and presses toward 7,433.68.
- Crude holds the upper part of its range or advances toward 90.31 while yields stay firm.
That combination shifts the session from a defensive gap to a broader volatility-expansion day. Avoid assuming that the first 30-minute low must hold.
Opening Repair
- Crude stops extending or reverses after the initial headline premium.
- The 10-year yield stabilizes instead of confirming the oil move.
- SPX holds or reclaims the 7,477.30 gamma pivot.
- NQ recovers the opening range and closes the relative-performance gap versus ES.
That setup would not erase the geopolitical risk. It would show that the market can absorb the information inside its expected range, making two-way trade and mean reversion more likely.
Execution Priorities
- Trade the reaction, not the first headline. Oil and index futures can reverse quickly as shipping or military updates cross.
- Use NQ leadership as confirmation. If NQ stays weakest, the risk-off message is more credible.
- Watch the SPX gamma pivot. Treat 7,477.30 as a delayed model reference that must agree with price and volatility.
- Respect the EIA window. The 10:30 a.m. release can change the oil impulse and the equity response.
- Size for the actual volatility. CL and GC have wide ranges, and NQ can travel hundreds of points without leaving its daily map.
For more on how these bands are used, review the PonoTrading Expected Moves framework and the full Market Pulse archive.
Bottom Line
Wednesday's open is a real cross-asset stress test. Tuesday's equity repair gives buyers a foundation, but renewed U.S.-Iran escalation, disrupted Hormuz shipping, and a roughly 4% oil jump raise the standard for confirmation.
The working map is straightforward: NQ is the downside leader, crude is the macro trigger, SPX 7,477.30 is the delayed model gamma pivot, ES 7,433.68 is the lower daily 1SD boundary, and the EIA report is the main scheduled volatility checkpoint.
If SPX holds the gamma pivot and oil stops extending, the opening weakness can repair inside the expected range. If SPX loses the pivot while NQ remains heavy and crude presses higher, manage the session as a volatility-expansion environment rather than a routine dip-buying setup.
Source note: Futures and ETF references are delayed planning snapshots collected before the July 22 cash open and are not executable exchange quotes. Expected-move ranges are volatility-derived statistical estimates, not option-straddle prices or forecasts. The gamma flip is a delayed, model-specific Modigin estimate and may differ from other providers. Market-driver context was verified against Associated Press reporting; scheduled events were checked against EIA, Tesla, and IBM sources.
Educational content only. This is not financial advice, investment advice, or a recommendation to buy or sell any security, option, futures contract, or digital asset. Trading involves substantial risk, including the possible loss of principal.
Related Articles

Quiet Monday. Nasdaq Already Spent the Easy Band.
FOMC week opens with no Tier-1 Monday print. NQ already through daily −1SD overnight off Friday’s 29,387 settle. CL reclaiming off $100.05. Wednesday owns the week.

Core Printed Hot. Oil Gave Back the Easy Band.
August CPI matched at +0.4% / 3.4%. Core +0.3% m/m / 2.4% y/y — hot on the month. CL through daily −1SD off the $102.48 settle. Equities reclaimed overnight. FOMC is next week.

Oil Already Spent the Band. PPI Printed Hot on the Year.
Crude already spent daily +1SD overnight on Middle East supply risk. NQ through daily −1SD. August PPI printed +0.4% m/m and +5.4% y/y — matched the month, a touch hot on the year. CPI is still Friday.