How Price Really Moves: Session Medians, Dealing Ranges, and Why Most Traders Miss It
Most traders stare at indicators waiting for a signal. Meanwhile, price is telling you exactly where it's going — if you understand how sessions hand off liquidity to each other.
March 30, 2026 • PonoTrading
Most traders stare at indicators waiting for a signal. Meanwhile, price is telling you exactly where it's going — if you understand how sessions hand off liquidity to each other.
Let me break down a real NQ chart from Friday's session that shows this concept in action.
The Setup
Before the New York open, three levels were already defined:
- Midnight Open (MNO) at 23,509 — the price where the overnight session found equilibrium during the midnight-to-morning window
- NYC (Prior Session Close) at 23,306.50 — where the previous New York session ended
- The RTH Gap — an inside gap up that needed to resolve
These aren't drawn after the fact. They're calculated before the session begins. Every single day.
What Happened
At the open, price displaced off the Midnight Open and sold through the session's developing dealing range. It didn't stop randomly — it found its floor precisely at the stacked NYC and MNO levels from the prior session near 23,300.
Then the real story began.
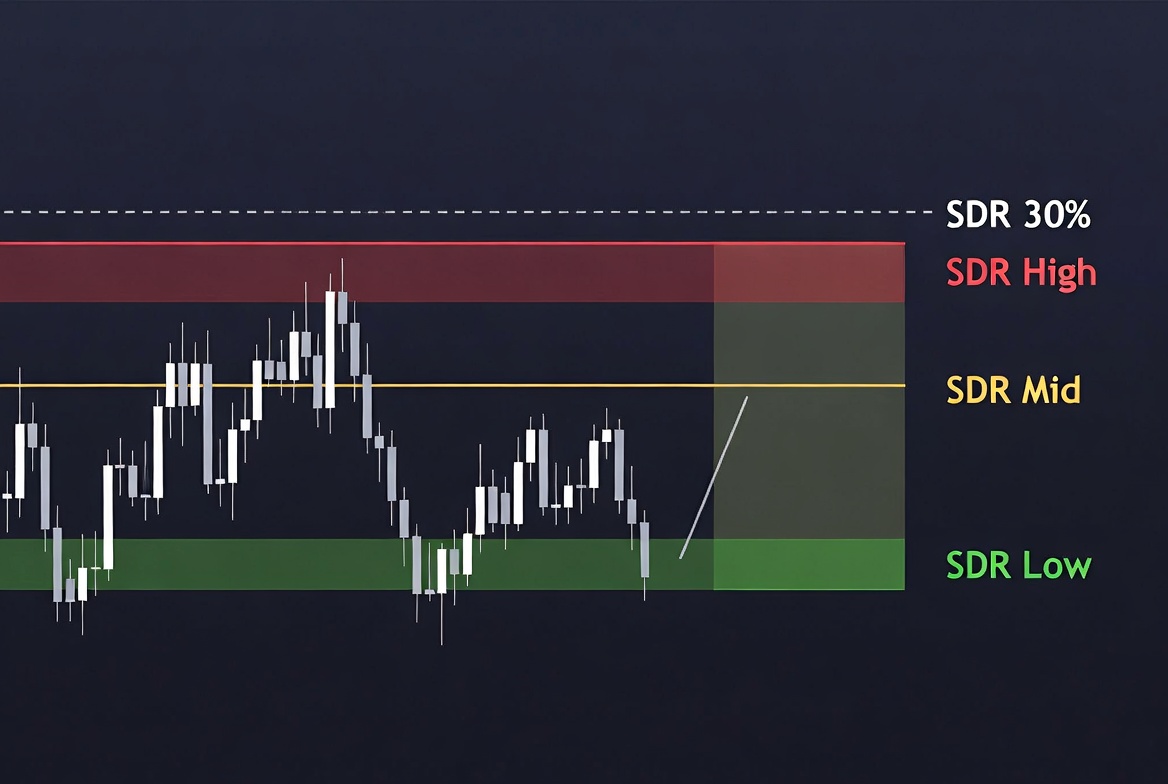
The dealing range median — the 50% level of the New York session's developing range — became the ceiling. Two separate swing highs formed right at that median zone around 23,400-23,410, and both rejected.
Price wasn't wandering. It was rotating between session reference points, using the dealing range median as the pivot.
Why This Matters
Here's what most traders get wrong: they think price "moves to levels." It doesn't. Price transfers liquidity between sessions. Each session creates a dealing range, and the median of that range becomes the equilibrium point — the price where buyers and sellers are most balanced.
When a new session begins, it either:
- Accepts the prior session's range (rotates within it)
- Rejects it (breaks out and establishes a new range)
The Friday chart showed textbook acceptance. Price sold from the overnight equilibrium (MNO), found demand at the prior session's close (NYC), then spent the rest of the day rotating around the new session's median.
The daily ATR was 91.1% consumed by the end — meaning price used almost its entire expected range for the day, and every major turn happened at a session-defined level.
The Backtest Supports It
This isn't just one chart. We've analyzed 958 trading days across ES, NQ, YM, and RTY:
- Midnight Open retracement: 71-72% of the time, price comes back to touch the Midnight Open level during the New York session
- NYC (prior close) retracement: 64-70% of the time
- When 3 of 4 correlated instruments hit their session level and 1 misses — the laggard catches up exactly 0% of the time
That last stat is the one that changes how you trade. When the market is telling you one instrument isn't participating, listen.
How to Use This
- Before the open: Mark your Midnight Open, NYC (prior close), and prior session dealing range median
- At the open: Watch how price reacts to the gap — does it fill? Reject? Accept the overnight range?
- During the session: The developing session median becomes your rotation axis. Swing highs and lows will gravitate toward it
- For targets: The prior session's median and the current session's median create your expected rotation range
Price isn't random. Sessions create structure. Medians define equilibrium. And the transfer between sessions is where the money is made.
Stop looking for the holy grail. Start understanding where you are in the session's dealing range — and where the session before left off.
Be the casino, not the gambler.
Written by
PonoTrading
PonoTrading publishes futures trading education, market structure notes, expected move analysis, and practical indicator workflows for retail traders.